
The Bureau of Labor Statistics reported that in March 2022 Inflation Hit 8.5%
Inflation Summary:
- Annual Inflation is the highest since December 1981.
- CPI Index rose from 283.716 to 287.504.
- Monthly Inflation for March was 1.34% up from February’s 0.91%
- The next release is on May 11th
March 2022 Annual Inflation was 8.54%.
Jan. 2021 — 1.40% ** Jan. 2022 — 7.48% ** Feb. 2022 — 7.87%
Higher Gasoline prices pushed inflation to new heights in March 2022. The last time inflation was higher was in December 1981 when it was 8.92% but then it was declining from the March 1980 peak of 14.76%.
Although we calculate it to two decimal places the Bureau of Labor Statistics reported March’s inflation rate as 8.5%.
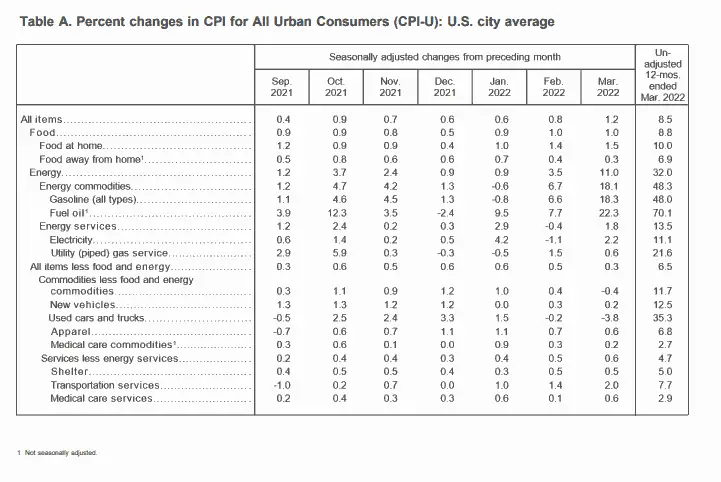
BLS March 2022 Inflation Report:
According to the BLS commissioner’s report, The Consumer Price Index for All Urban Consumers (CPI-U) increased 1.2 percent in March on a seasonally adjusted basis after rising 0.8 percent in February, the U.S. Bureau of Labor Statistics reported today. Over the last 12 months, the all items index increased 8.5 percent before seasonal adjustment. Increases in the indexes for gasoline, shelter, and food were the largest contributors to the seasonally adjusted all items increase. The gasoline index rose 18.3 percent in March and accounted for over half of the all items monthly increase; other energy component indexes also increased. The food index rose 1.0 percent and the food at home index rose 1.5 percent.
Of course, they round the annual inflation rate to a single decimal place, we prefer a bit finer view so we round it to 8.54%.
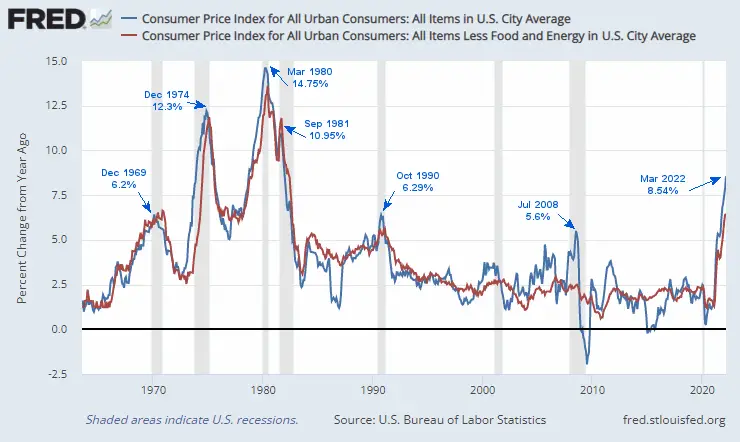
 Looking at the long-term inflation chart below, current levels have exceeded the July 2008 peak of 5.6%, the December 1969 peak of 6.2%, and the October 1990 Peak of 6.29%.
Inflation All Items vs. Core Inflation Chart
At its March meeting, the Fed signaled that it will be reducing its massive bond holdings at a maximum pace of $95 billion a month, in an effort to cool inflation. This is set to begin in May. In the meantime, the government is tapping the strategic petroleum reserves in an effort to drive down prices. Which has had some effect so far. See Inflation Adjusted Gas Prices.
The Moore Inflation Predictor chart has flattened out drastically from last month’s chart due to the FED’s pronouncement. But we will continue including the dotted blue line projecting what will happen if the FED doesn’t act quickly or decisively enough, so inflation doesn’t return to normal. Economists expect inflation to settle back to an average 5.7% in the fourth quarter. But even our lowest “Extreme Low” projection only takes it to around 6%.
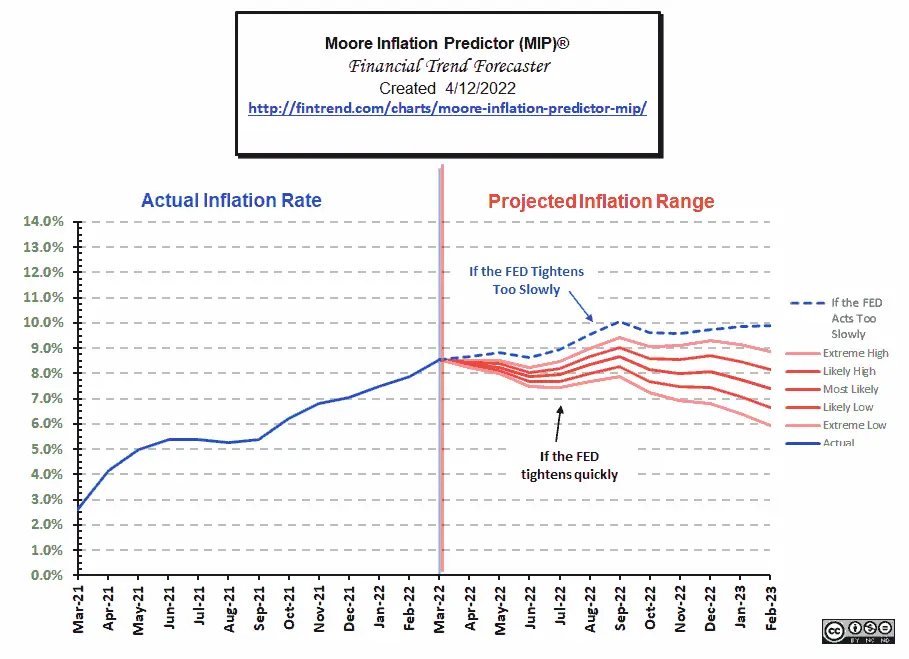
Even if the economists are right that is still almost TRIPLE the FED’s target 2% range. Federal Reserve Bank of Cleveland President Loretta Mester doesn’t expect inflation to get back down to the target range for at least another year.
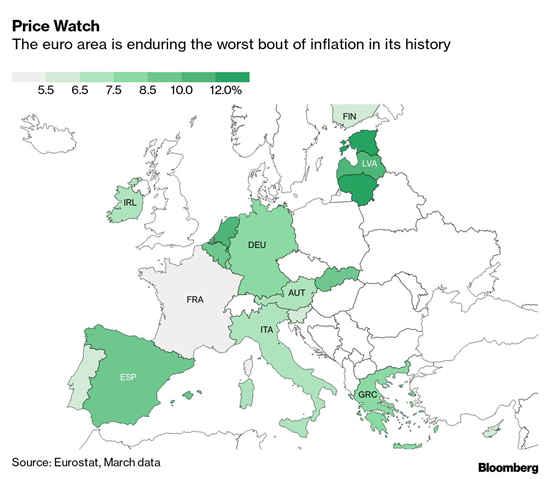
It isn’t just our Central Bank that has been printing money for too long European Central Banks have followed our lead and are now in the same situation as we are.
Monthly Inflation:
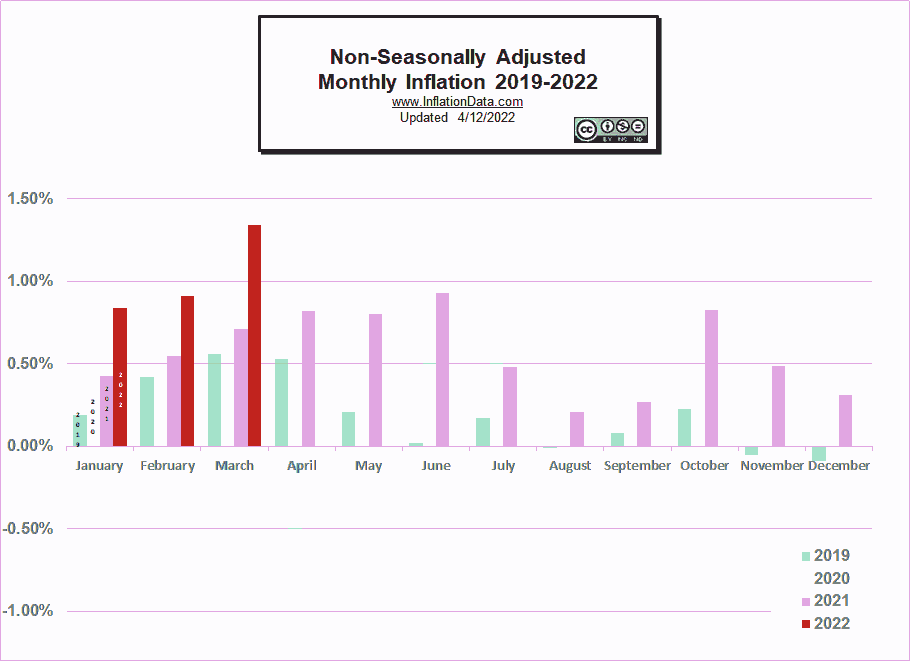
February 2021’s 0.55% monthly inflation was replaced by February 2022’s 0.91% increasing the Annual inflation rate from 7.48% to 7.87%. March 2021’s 0.71% monthly inflation was replaced by March 2022’s monthly Inflation of 1.34% increasing Annual Inflation from 7.87% to 8.54%.
As recently as last year, 1.34% was almost a whole year’s inflation rather than just a single month. Annual inflation in January 2021 was 1.40%.
| January | February | March | April | May | June | |
| 2021 | 0.43% | 0.55% | 0.71% | 0.82% | 0.80% | 0.93% |
| 2022 | 0.84% | 0.91% | 1.34% |
At 0.84% (January), 0.91% (February), and 1.34% (March) monthly inflation was high even for the first quarter of the year when monthly inflation is already at its highest. Typically monthly inflation from January through May is in the 0.30% to 0.50% range. And then, in June, inflation typically starts to moderate into a lower range, and then October through December is typically very low or even negative. But, as we can see from the table above, 2021 was consistently above that range and 2022 is starting out even higher.
Note that January 2022’s 0.84% was the highest January since 1990.
See Annual Inflation for more information.
Not Seasonally Adjusted Monthly Inflation Rates
Note: January 2022’s 0.84% was the highest January since 1990.
| Jan | Feb | Mar | Apr | May | Jun | Jul | Aug | Sep | Oct | Nov | Dec | |
| 2016 | 0.17% | 0.08% | 0.43% | 0.47% | 0.41% | 0.33% | (0.16%) | 0.09% | 0.24% | 0.12% | (0.16%) | 0.03% |
| 2017 | 0.58% | 0.31% | 0.08% | 0.30% | 0.09% | 0.09% | (0.07%) | 0.30% | 0.53% | (0.06%) | 0.002% | (0.06%) |
| 2018 | 0.54% | 0.45% | 0.23% | 0.40% | 0.42% | 0.16% | 0.01% | 0.06% | 0.12% | 0.18% | (0.33%) | (0.32%) |
| 2019 | 0.19% | 0.42% | 0.56% | 0.53% | 0.21% | 0.02% | 0.17% | (0.01%) | 0.08% | 0.23% | (0.05%) | (0.09%) |
| 2020 | 0.39% | 0.27% | (0.22%) | (0.67%) | 0.002% | 0.55% | 0.51% | 0.32% | 0.14% | 0.04% | (0.06%) | 0.09% |
| 2021 | 0.43% | 0.55% | 0.71% | 0.82% | 0.80% | 0.93% | 0.48% | 0.21% | 0.27% | 0.83% | 0.49% | 0.31% |
| 2022 | 0.84% | 0.91% | 1.34% |
See: Monthly Inflation Rate for more information and a complete table of Unadjusted Monthly Rates.
Federal Reserve Actions
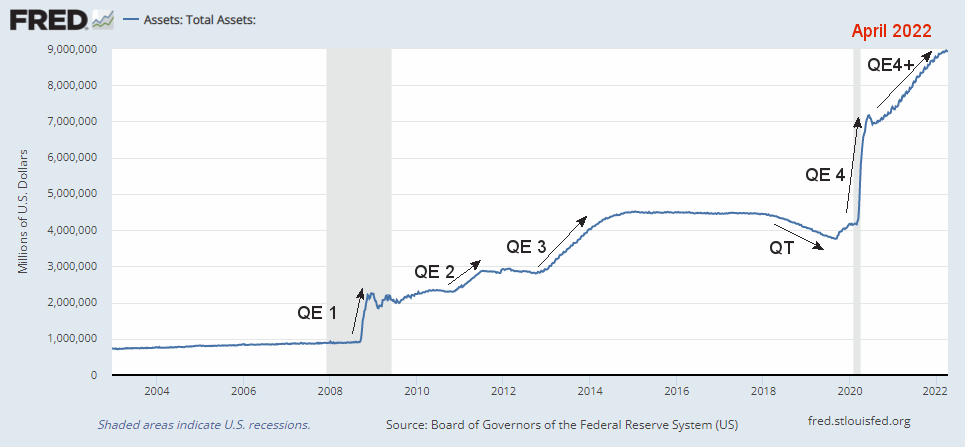
In the following chart, we see the Federal Reserve Total Assets have stair-stepped up over the last year. The FED announced that it end QE4 in March and will begin tightening (i.e. reducing assets) in May. Since the stock market is addicted to ever higher shots of QE, we can expect if their supply is cut off the market will crash.
FED Assets Closeup
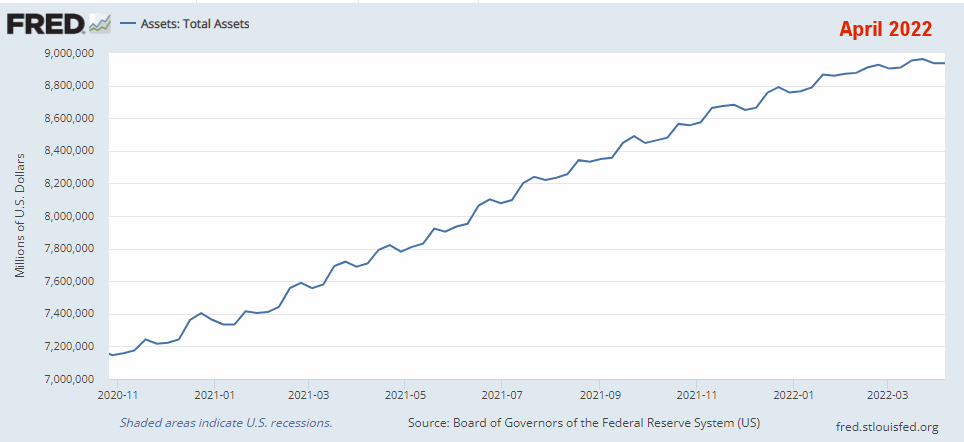
Looking at FED assets just over the last year, we can see how they stair-stepped up. For March, we can see a slight decline in assets but we’ve seen many of those over the last year as well. So it will be interesting to see what happens beginning in May.
FED Funds Rate
In March 2022 the FED finally raised interest rates to begin fighting inflation, raising rates from a minuscule 8/100% (0.08%) to 0.20%. This may sound like a big move since it is more than double previous rates but from a historical perspective, it is still virtually zero. As recently as 2019, rates were 12 times higher than the March rate at 2.42%. In 2007 they were over 5% and the last time inflation was this high, rates were at 14.94% to combat inflation.
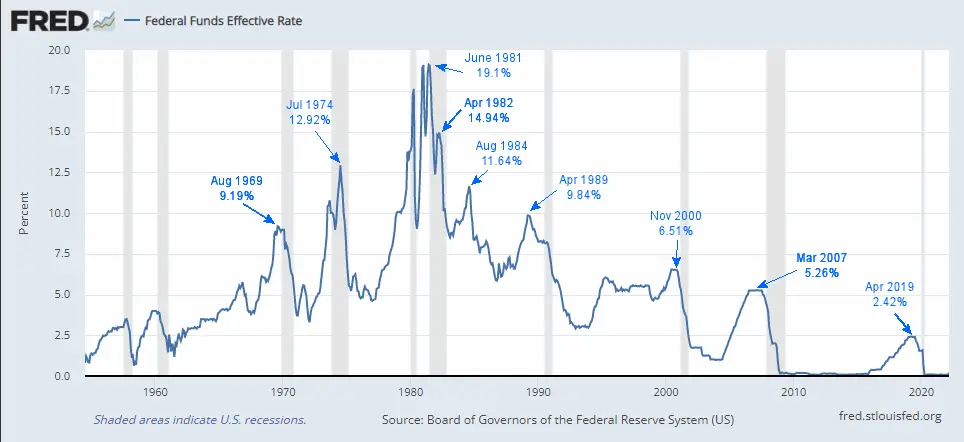
Chart Data Source St Louis FED.
For more info, See NYSE ROC and MIP.
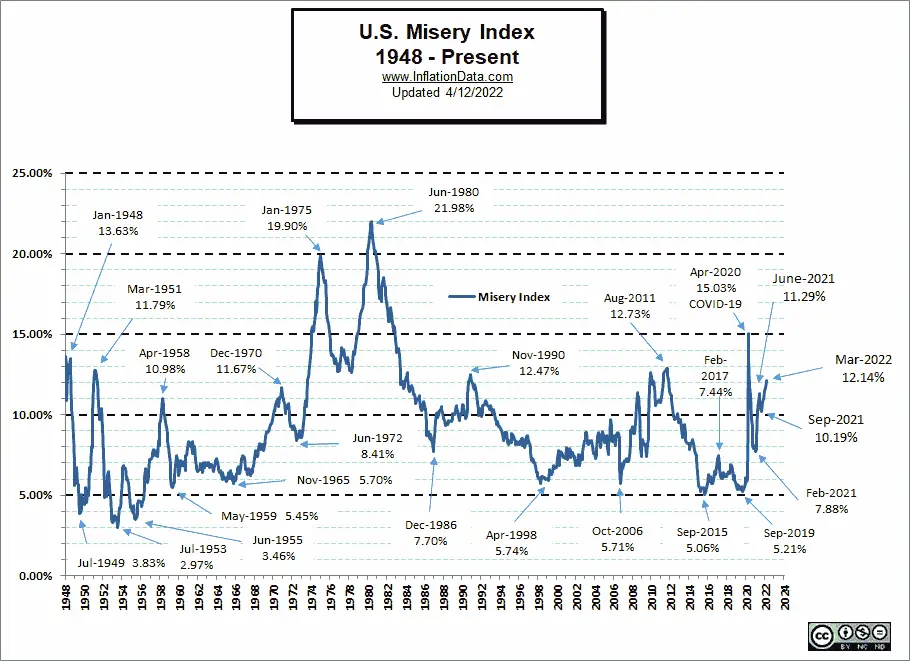
Misery Index
Even though unemployment was down, in March, Inflation was up more, so the Misery index increased again.
| Unemployment | Inflation | Misery Index | |
| January 2022 | 4.0% | 7.48% | 11.48% |
| February 2022 | 3.8% | 7.87% | 11.67% |
| March 2022 | 3.6% | 8.54% | 12.14% |
[Read More…]
NYSE Rate of Change (ROC)©

Sell Signal
Despite the index moving up, the NYSE ROC index is still below its moving average.
See the NYSE ROC for more info.
NASDAQ Rate of Change (ROC)©

Sell Signal
The NASDAQ ROC, still well below its moving average.
See NASDAQ ROC for more.
You Might Also Like:
From InflationData.com
- Does the CPI Exclude Mortgages or Rent?
- The History of Inflation in the United States
- How Inflation Helps Some and Hurts Others
- Don’t Blame Putin for High U.S. Inflation… Yet
- How Should You Invest to Benefit From Inflation?
- Hyperinflation in Turkey and Argentina Today?
- Former Treasury Secretary Larry Summers on the Current Inflation Situation
- How Quickly Can The FED Get Inflation Under Control?
- How Nixon’s Revolutionary Move Influenced U.S. Inflation For 50 Years
From UnemploymentData.com.
- What Is Hot Shot Trucking?
- March 2022 Unemployment Not as Low as Expected
- February Employment / Unemployment Report
- Make Your Future With A Medical Assistant Career
- Excellent Six-Figure Careers To Consider
- Create A Great Construction Job Resume For Better Responses
From Financial Trend Forecaster
- NYSE ROC Chart
- NASDAQ ROC Chart
- Can Ruthless Governments Make Crypto Worthless?
- Will Russian Sanctions Open a Can of Worms?
- In What Universe is $100+ Crude Oil Cheap?
- Economic Warfare Deployed Against Russia
- The Surprising Implications Of Declining Global Birth Rates
- What is Entity Extraction and Why Should You Care?
- Technology And The Semiconductor Chip Shortage
- Remarkably Quick And Easy Alternative House Building Methods
- How Blockchain’s Unique Innovations Can Prevent Money Remittance Scams
- Are 3D Printed Houses the Trend of the Future?
From Elliott Wave University
- Germany’s DAX: What You Can Learn from the 2007 Top
- The Market is Currently a “Mixed Bag”
- The Journey to High-Confidence Trading Starts Now!
- Historically Investors Become “Long-term Buyers” at Precisely the Wrong Time
- Why the “60 / 40 Balance” May Be Hazardous to Your Portfolio
- Warning: Mergers And Acquisitions Can Vaporize The Stock Market
- Is the Correction Over?
- Euro: Look at This Head & Shoulders Chart Formation
From OptioMoney.com
- Guide to Managing Small Business Finances
- Unlock The Benefits Of A Good Credit Score
- Buying A Home When You Are Already In Debt
- Top 10 Tasks Businesses Should Outsource in 2022
- 7 Unexpected Costs Of Moving To A New Home
From Your Family Finances
- What You Need To Know About Water Damage Before Buying A Home
- How to Teach Your Teen to Budget Like a Pro
- How to Get the Best Deal on Car Insurance
- How to Prepare for a Monthly Mortgage Payment With Kids
- Everything you need to know about buying a car
- 8 Amazing Pros And Cons Of Living In Florida
- Practical Tips to Organize Your Finances to Buy a House
- Should You Exploit High House Prices To Pay Off Debt?

Leave a Reply