
The Annual Inflation Rate rebounded in September, according to the Bureau of Labor Statistics report.
Inflation Summary:
- Annual inflation was 5.39% in September, 5.25% in August, 5.37% in July, and 5.39% in June.
- CPI Index rose from 273.567 in August to 274.310 in September.
- Monthly Inflation for September was 0.27%, August was 0.21%, and July was 0.48%.
- Next release November 10th
Inflation for the 12 months ending in September was Up from August.
Since the BLS rounds to 1 decimal place, they reported June and July as 5.4% and August as 5.3%. So September is once again at June levels.
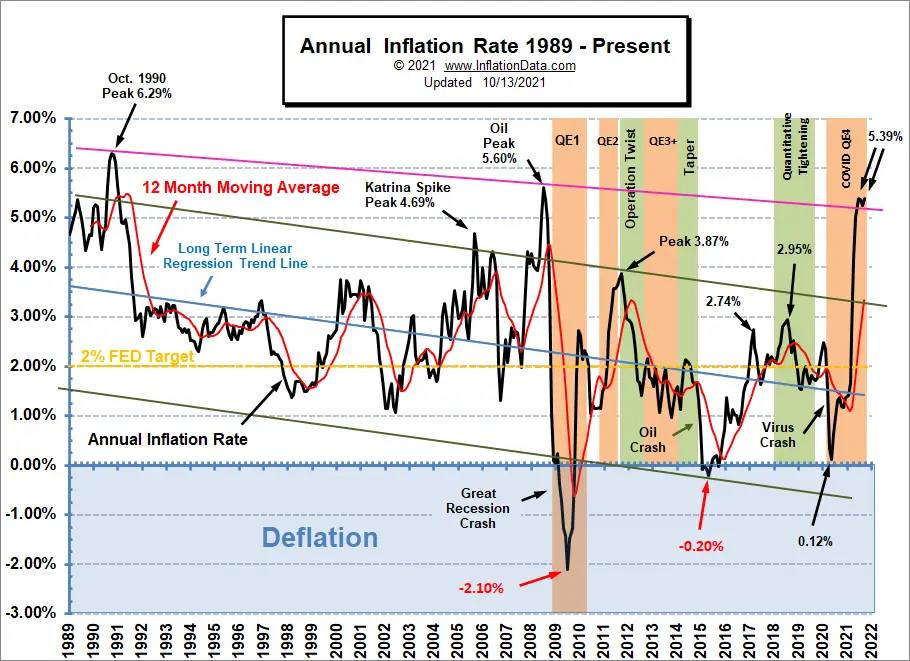
The last time inflation was this high was the 5.60% of July 2008. Before that, we have to go back to the 6.29% of October 1990 to find a higher peak. The resistance line (pink) between those peaks is currently being tested. A little over a year ago, May 2020’s low was 0.12%, and the FED worried about Deflation. Now, we are well above 5%, which is typically when the public starts getting concerned about inflation.
BLS Commissioner’s Inflation Report:
According to the BLS commissioner’s report,
“The Consumer Price Index for All Urban Consumers (CPI-U) increased 0.4 percent in September on a seasonally adjusted basis after rising 0.3 percent in August, the U.S. Bureau of Labor Statistics reported today. Over the last 12 months, the all items index increased 5.4 percent before seasonal adjustment.
The indexes for food and shelter rose in September and together contributed more than half of the monthly all items seasonally adjusted increase. The index for food rose 0.9 percent, with the index for food at home increasing 1.2 percent. The energy index increased 1.3 percent, with the gasoline index rising 1.2 percent.”
Seasonally Adjusted Inflation Components Table
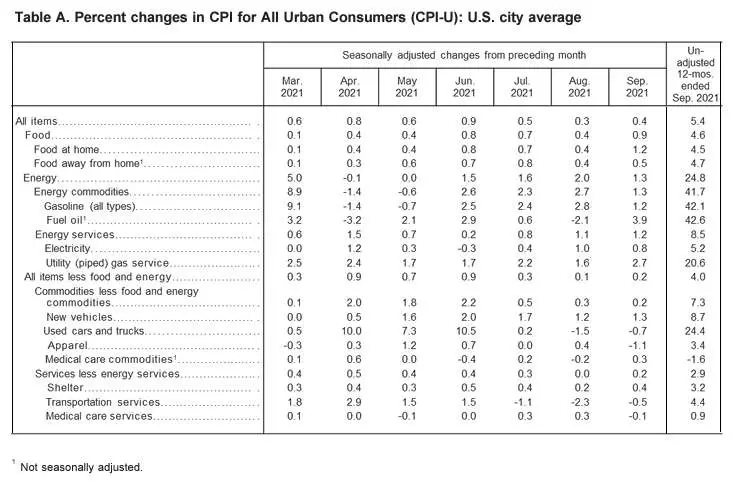 The two major areas of inflation are Energy and Used Vehicles. Energy commodities are up a whopping 41.7%. These chemicals are used in a variety of other things like Paint, which drives up their prices. Gasoline is up 42.1% over the year while Natural Gas is “only” up 20.6%. The other major area of price increases is Used Cars which are up 24.4%. This is primarily due to a shortage of new vehicles due to the chip shortage. So as we can see, it is a cascade effect as one item causes shortages in other items further up the chain.
See: From Pandemic To 2021 Supply Chain Disruption for more information. We’ve also updated the Inflation Adjusted Corn prices chart.
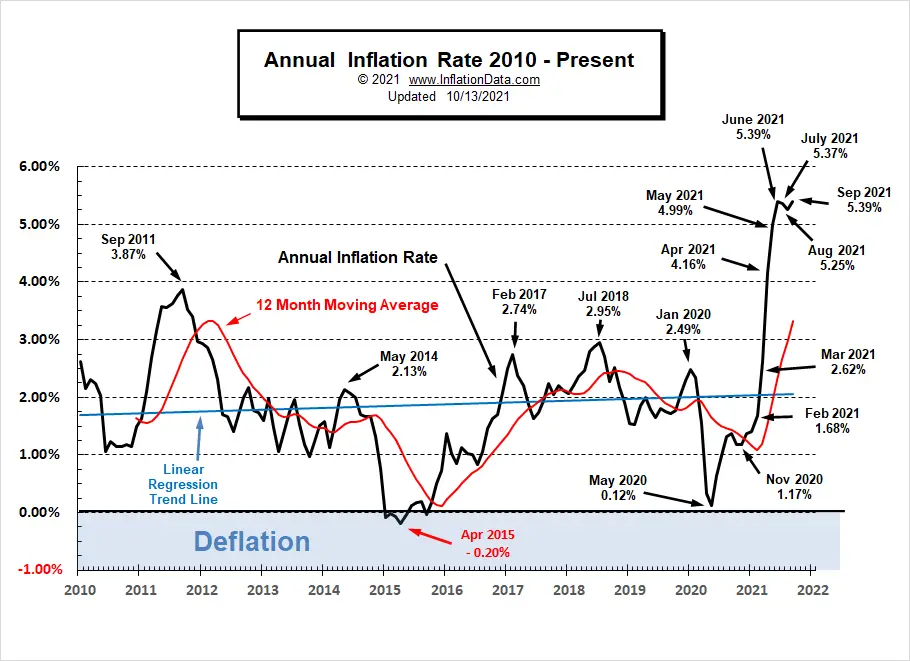
September 2021 Inflation Situation
Last month we noted that the downtrend on the chart since 2010 no longer exists. Up until then, the linear regression line was tilted slightly downward. But as you can see, the current upward spike in inflation has shifted it upward. So looking only at this chart it is hard to believe that the long-term trend was down.
Another notable feature of this chart is the double peak in June and September. The key question at this point is whether October’s numbers will make a new high or whether it will fall from here. Monthly inflation was pretty normal for September, so if the 4th quarter comes in normal, we will see a leveling off at current levels. But normal 4th quarter monthly rates are much lower than 3rd quarter rates. So if the 4th quarter comes in at 3rd quarter rates we will see another major jump in inflation rates.
 See Annual Inflation for more information.
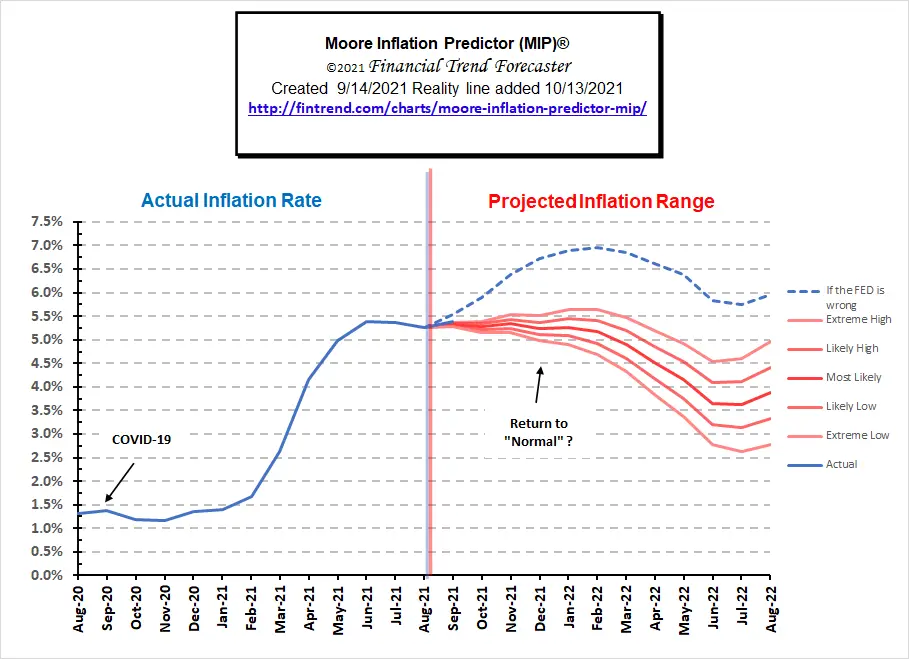
Moore Inflation Predictor
For the last several months, we’ve included a higher than typical projection called “if the FED is wrong,” and it has (if anything) been too low. August’s projection fell exactly on the median “most likely” line. And although it’s difficult to see in September’s projection below, the actual line fell just a hair above the extreme high but still well below the “if the FED is wrong” projection. But we can also see how flat the normal projections are for the next few months. But that’s still a big “IF”.
 See our Moore Inflation Predictor for this month’s projection.
Not Seasonally Adjusted Monthly Inflation Rates
As we can see from the table below, the monthly numbers for the 4th quarter of 2020 are very low. If 2021 numbers come in above those numbers, the annual inflation rate will rise.
| Jan | Feb | Mar | Apr | May | Jun | Jul | Aug | Sep | Oct | Nov | Dec | |
| 2016 | 0.17% | 0.08% | 0.43% | 0.47% | 0.41% | 0.33% | (0.16%) | 0.09% | 0.24% | 0.12% | (0.16%) | 0.03% |
| 2017 | 0.58% | 0.31% | 0.08% | 0.30% | 0.09% | 0.09% | (0.07%) | 0.30% | 0.53% | (0.06%) | 0.002% | (0.06%) |
| 2018 | 0.54% | 0.45% | 0.23% | 0.40% | 0.42% | 0.16% | 0.01% | 0.06% | 0.12% | 0.18% | (0.33%) | (0.32%) |
| 2019 | 0.19% | 0.42% | 0.56% | 0.53% | 0.21% | 0.02% | 0.17% | (0.01%) | 0.08% | 0.23% | (0.05%) | (0.09%) |
| 2020 | 0.39% | 0.27% | (0.22%) | (0.67%) | 0.002% | 0.55% | 0.51% | 0.32% | 0.14% | 0.04% | (0.06%) | 0.09% |
| 2021 | 0.43% | 0.55% | 0.71% | 0.82% | 0.80% | 0.93% | 0.48% | 0.21 | 0.27 |
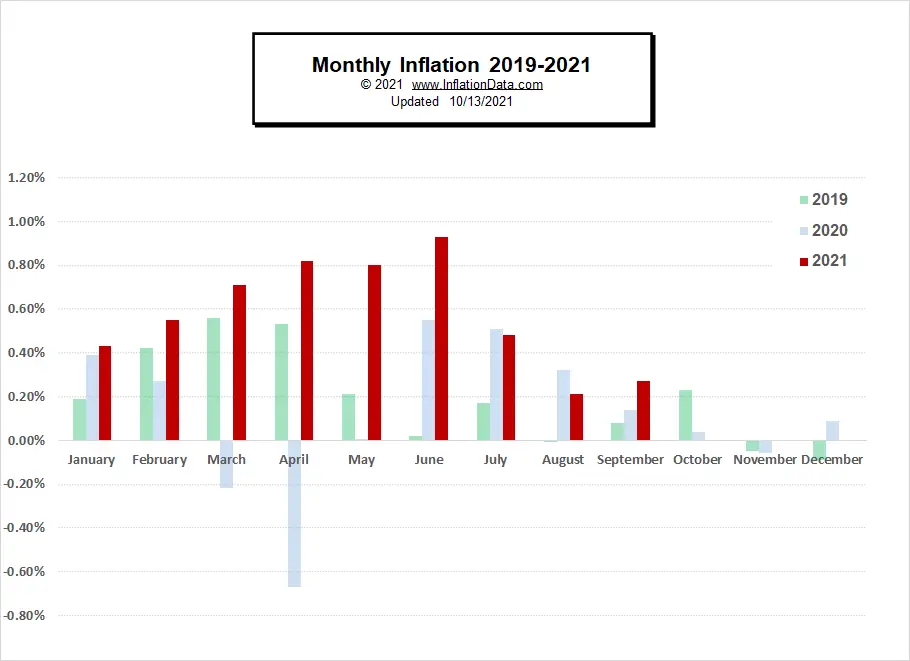
See: Monthly Inflation Rate for more information and a complete table of Unadjusted Monthly Rates.
Federal Reserve Actions
The FED refused to commit to cutting back at their most recent meeting.
FED Funds Rate
As a matter of fact, they actually lowered the FED funds rate, albeit a minuscule 1/100% to 0.08% from 0.09%.
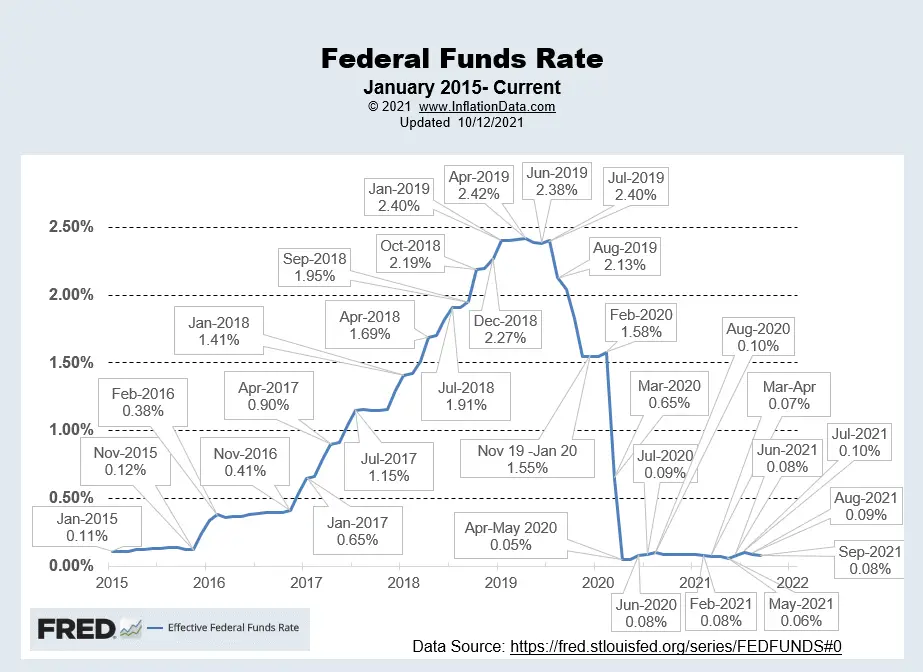 Chart Source St Louis FED.
For more info, See NYSE ROC and MIP.
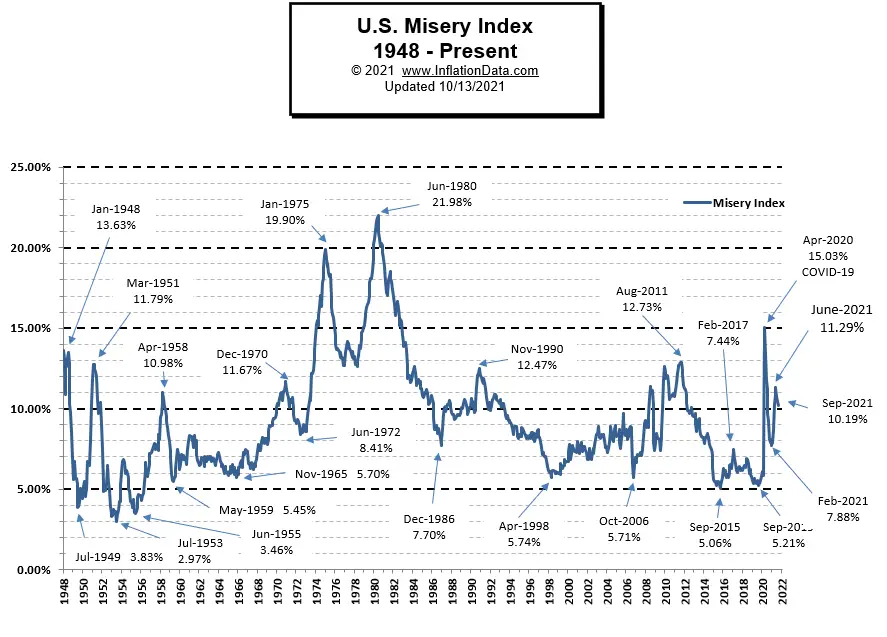
Misery Index
The misery index fell along with the inflation rate and unemployment.
 [Read More…]
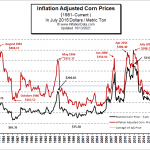 Inflation-Adjusted Price of Corn
We’ve updated the inflation-adjusted price of corn chart.
See: Inflation-Adjusted Price of Corn
NYSE Rate of Change (ROC)©

Sell? Signal
The NYSE ROC index is down at its moving average.
See the NYSE ROC for more info.
NASDAQ Rate of Change (ROC)©

Sell Signal
The NASDAQ ROC, on the other hand, has fallen well below its moving average generating a Sell signal unless the NASDAQ spikes up in the next couple of months.
See NASDAQ ROC for more.
You Might Also Like:
From InflationData.com
- Why is a Little Bit of Inflation Considered Good for the Economy?
- FED Issues September 2021 Statement
- How to Prepare for Inflation
- Safe-Haven Investments that Protect Your Capital From Rising Inflation
- 9 Inflation Books You Must Read
- Hyperinflation Strikes Lebanon… Again
From UnemploymentData.com.
- September Unemployment Disappointing
- Great Careers: No College Degree Necessary
- Blue State Unemployment is 33.33% Higher Than Red States
- 6 Reasons to Know Your Rights as an Employee
- New Careers in Workforce Management
From Financial Trend Forecaster
- From Pandemic To 2021 Supply Chain Disruption
- Batteries: New Sea-Water Based Battery to Replace Lithium
- Farming: Discovering New Ways to Feed the Planet
- Fintech: The New Financial Management Disruptive Technology
- Record Credit Card Debt Reduction
- The Making of the Next Housing Crisis
- Which is Over Priced? Oil or Gold?
- What are NFTs, and Why are They Going Crazy?
From Elliott Wave University
- Why a Financial “Panic” May Be Just Around the Corner
- “Kiss of Death” Stock Market Indicator
- Will Oil Prices Skyrocket in the Aftermath of Hurricane Ida?
- Be Prepared “Or Else”
- The Maniacal Residential Real Estate Market
- Why the Stock Market is the True “Great Deceiver”
From OptioMoney.com (New Look)
- Moving to a Cheaper City: Is It Worth It?
- How to Prepare for a Severe Storm
- Is Downsizing Right for You?
- The Best Investment Advice for Beginners
- Secrets for Lucrative Investment Properties
From Your Family Finances (New Look)
- 5 Ways You Can Save More Money Every Month
- Bargain Retirement Overseas in Malaysia?
- How to Prepare Your Finances for Life Changes
- How Modern Tech Can Enhance Your Real Estate Investing
- How Making Small Car Repairs Can Save You Money in the Future

Leave a Reply