
The Bureau of Labor Statistics reported that in June 2022, Annual Inflation rose to 9.1%
Inflation Summary:
- Annual Inflation Rose from 8.58% in May to 9.06% in June
- CPI Index rose from 292.296 to 296.311
- Monthly Inflation for June was 1.37%, the highest June since 1941
- The next release is on August 10th
June 2022, Annual Inflation was 9.06%.
Jan. 2021 — 1.40% ** Jan. 2022 — 7.48% ** Feb. 2022 — 7.87% ** March 8.54%
Apr. 2022 –8.26% ** May 2022 — 8.58% ** June 2022 — 9.06%
Crude Oil prices averaged over $100 per barrel for June. While according to the AAA, Regular Gasoline prices averaged $5.016 in mid-June.
Monthly Inflation
At 0.84% (January), 0.91% (February), and 1.34% (March), monthly inflation was high even for the first quarter of the year, when monthly inflation is typically at its highest. April is the only month so far this year to come in lower than 2021. Monthly Inflation for May was again above 2021, and June was 1.37%, the highest June since 1941.
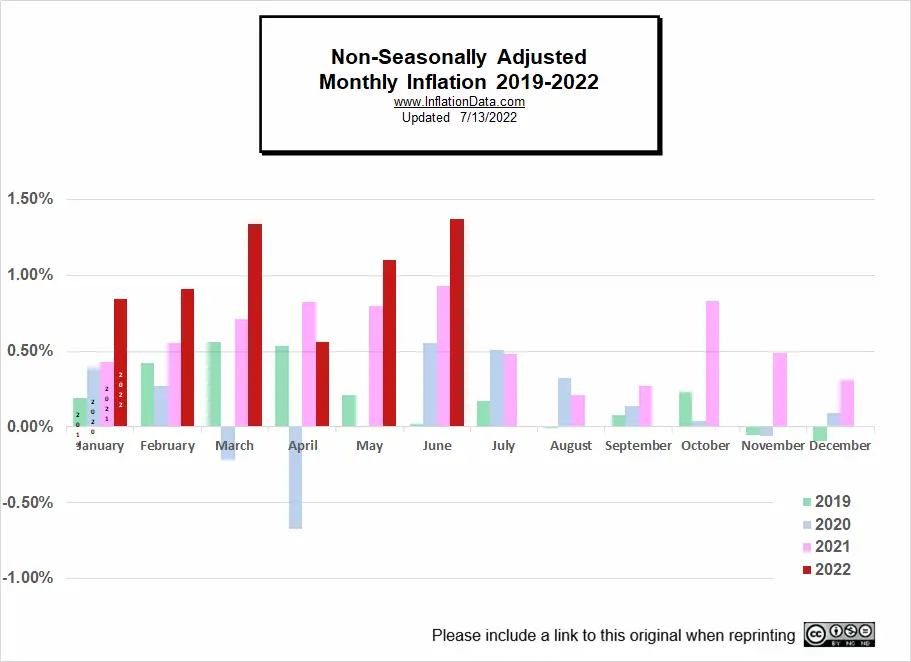
Not Seasonally Adjusted Monthly Inflation Rates
Note: January 2022’s 0.84% was the highest January since 1990. June was the highest June since 1941 (although the first quarter of 1980 had some higher rates). Typically, June is the beginning of lower monthly rates.
| Jan | Feb | Mar | Apr | May | Jun | Jul | Aug | Sep | Oct | Nov | Dec | |
| 2016 | 0.17% | 0.08% | 0.43% | 0.47% | 0.41% | 0.33% | (0.16%) | 0.09% | 0.24% | 0.12% | (0.16%) | 0.03% |
| 2017 | 0.58% | 0.31% | 0.08% | 0.30% | 0.09% | 0.09% | (0.07%) | 0.30% | 0.53% | (0.06%) | 0.002% | (0.06%) |
| 2018 | 0.54% | 0.45% | 0.23% | 0.40% | 0.42% | 0.16% | 0.01% | 0.06% | 0.12% | 0.18% | (0.33%) | (0.32%) |
| 2019 | 0.19% | 0.42% | 0.56% | 0.53% | 0.21% | 0.02% | 0.17% | (0.01%) | 0.08% | 0.23% | (0.05%) | (0.09%) |
| 2020 | 0.39% | 0.27% | (0.22%) | (0.67%) | 0.002% | 0.55% | 0.51% | 0.32% | 0.14% | 0.04% | (0.06%) | 0.09% |
| 2021 | 0.43% | 0.55% | 0.71% | 0.82% | 0.80% | 0.93% | 0.48% | 0.21% | 0.27% | 0.83% | 0.49% | 0.31% |
| 2022 | 0.84% | 0.91% | 1.34% | 0.56% | 1.10% | 1.37% |
See: Monthly Inflation Rate for more information and a complete table of Unadjusted Monthly Rates.
BLS June 2022 Inflation Report:
The BLS Commissioner reported: “The Consumer Price Index for All Urban Consumers (CPI-U) increased 1.3 percent in June on a seasonally adjusted basis after rising 1.0 percent in May, the U.S. Bureau of Labor Statistics reported today. Over the last 12 months, the all items index increased 9.1 percent before seasonal adjustment. The increase was broad-based, with the indexes for gasoline, shelter, and food being the largest contributors. The energy index rose 7.5 percent over the month and contributed nearly half of the all items increase, with the gasoline index rising 11.2 percent and the other major component indexes also rising. The food index rose 1.0 percent in June, as did the food at home index…
The all items index increased 9.1 percent for the 12 months ending June, the largest 12-month increase since the period ending November 1981. The all items less food and energy index rose 5.9 percent over the last 12 months. The energy index rose 41.6 percent over the last year, the largest 12-month increase since the period ending April 1980. The food index increased 10.4 percent for the 12-months ending June, the largest 12-month increase since the period ending February 1981.”
The BLS reports inflation to one decimal place so they reported June inflation to be 9.1% and May to be 8.6%, but we look at the numbers to two decimal places, so we see that they were 9.06% and 8.58%, respectively.
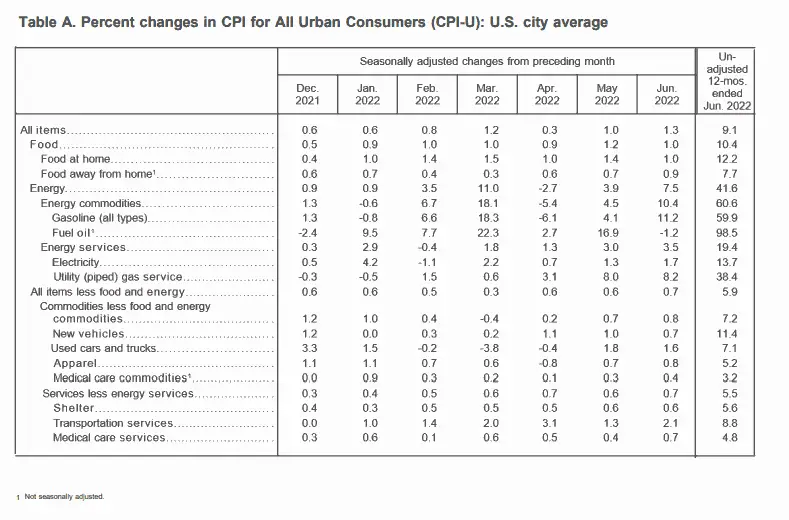 Food and energy were the most significant contributors to the higher inflation rate. Of course, everyone needs them, but they are also the most affected by non-monetary forces such as war, weather, and OPEC. Looking at the table above we can see that All Items less Food and Energy rose 5.9%… considerably below 9.06%. So it seems like the war in Ukraine is aggravating an already bad situation.
Inflation All Items vs. Core Inflation Chart
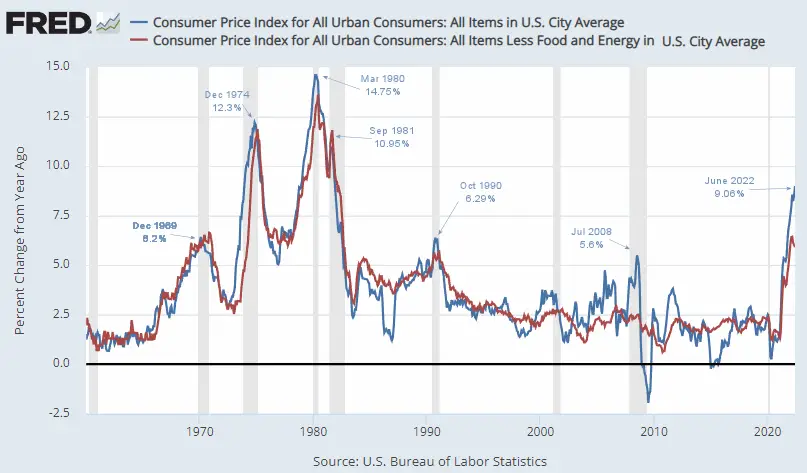
Looking at the chart above, we can see the difference between inflation with food and energy and without.
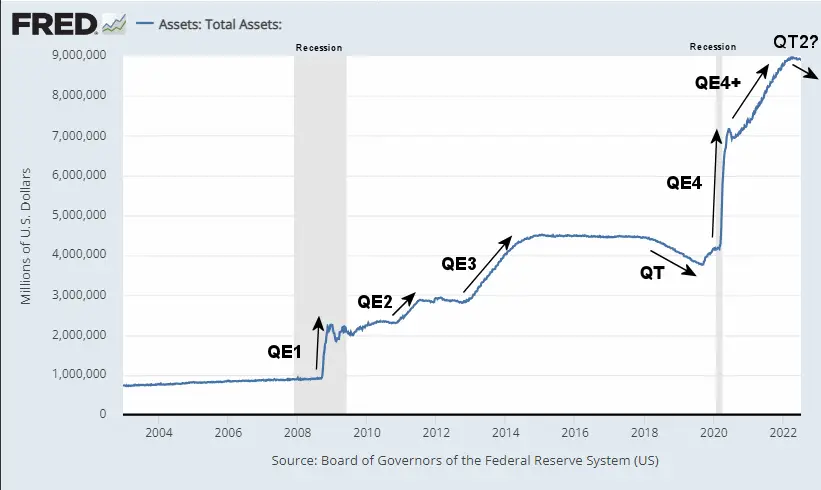
The FED’s total assets have started to level out and even declined a bit, but there is a long way to go to get back to 2019 levels, and that will involve a lot of economic pain, so the question is if the FED will chicken out before it gets there.
Moore Inflation Predictor
Last month even our most aggressive prediction underestimated the level of inflation.
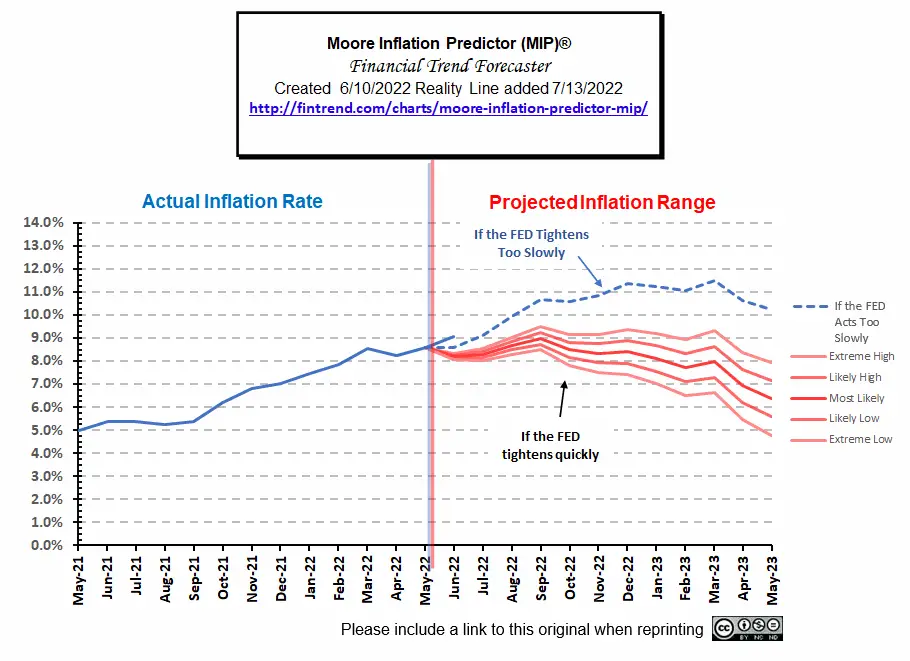
See our current inflation projections here.
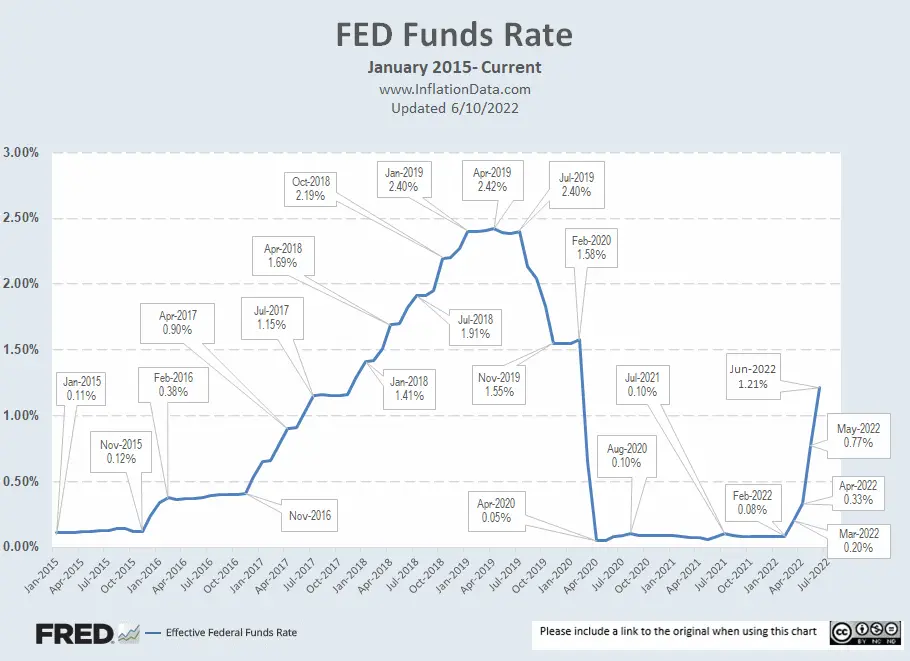
FED Funds Rate
In June 2022, the FED raised interest rates to 1.21%.
 Although the FED’s announcement sounds aggressive, many commentators don’t believe it is enough to fight inflation. Jeffrey Tucker says, “The Fed’s theory is that it can put out the house fire by carefully spraying a bit of water here and there in a way that doesn’t cause shock and alarm.”
Others are saying to be economically viable short-term interest rates need to be higher than the inflation rate, i.e., investors need to earn a “real rate of return”.
As recently as 2019, rates were at 2.42%. In 2007 they were over 5%, and the last time inflation was this high, rates were at 14.94% to combat inflation.
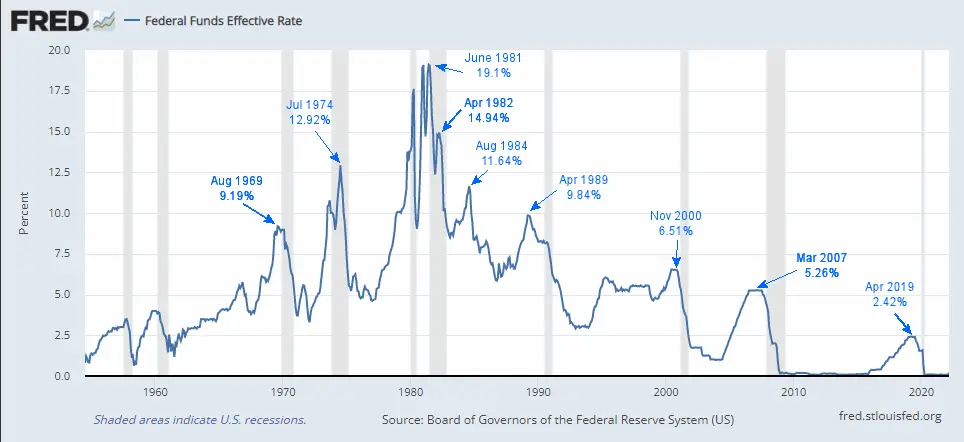
Chart Data Source St Louis FED.
For more info, See NYSE ROC and MIP.
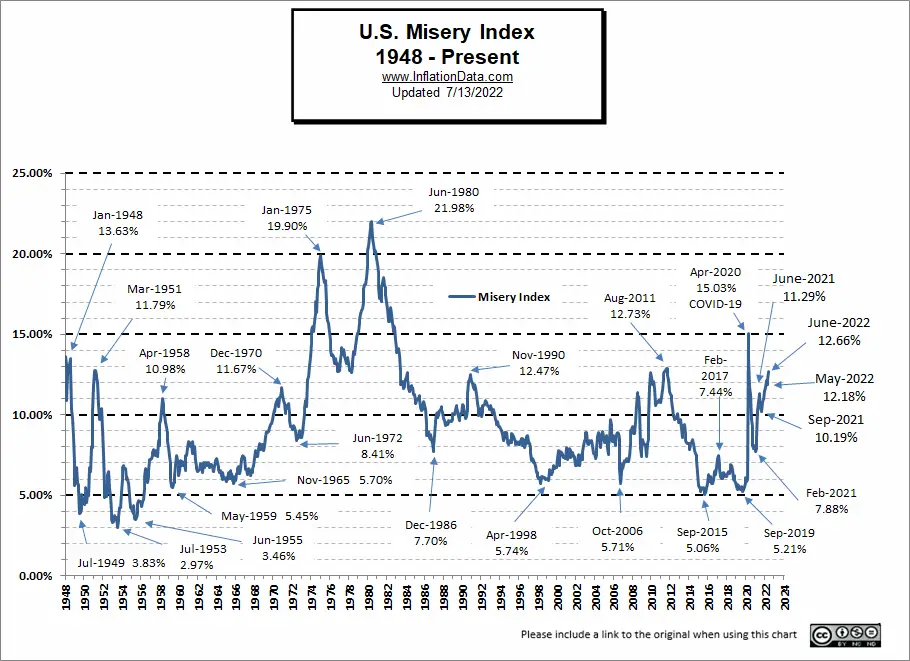
Misery Index
Unemployment was unchanged in April, and Inflation was down slightly, so the Misery index decreased.
| Unemployment | Inflation | Misery Index | |
| January 2022 | 4.0% | 7.48% | 11.48% |
| February 2022 | 3.8% | 7.87% | 11.67% |
| March 2022 | 3.6% | 8.54% | 12.14% |
| April 2022 | 3.6% | 8.26% | 11.86% |
| May 2022 | 3.6% | 8.58% | 12.18% |
| June 2022 | 3.6% | 9.06% | 12.66% |
[Read More…]
NYSE Rate of Change (ROC)©

Sell Signal
The NYSE ROC index is WAY below its moving average.
See the NYSE ROC for more info.
NASDAQ Rate of Change (ROC)©

Sell Signal
The NASDAQ ROC is well below its moving average.
See NASDAQ ROC for more.
You Might Also Like:
From InflationData.com
- The Many Evils of Inflation
- July 4th Cookout Will Cost You 17% More in 2022
- Surprise, Surprise, The FED Raises Rates by .75%
- Inflation Takes a Bite Out of Your Food Budget
- Inflation Adjusted Gasoline Hits New High
- Worldwide Inflation by Country 2022
- Analyzing 5 Ways You Can Hedge Against Surging Inflation
From UnemploymentData.com.
- June 2022 BLS Jobs Report- Recession Indicators?
- May 2022- Unemployment by State
- May Employment Up – Unemployment Unchanged
- How Is Time Management Important In The Workplace?
- Top Cities for Gig Worker Opportunities
From Financial Trend Forecaster
- NYSE ROC Chart
- NASDAQ ROC Chart
- How Low Can the S&P 500 Go?
- France’s War on Terror Uses Eagles to Catch Drones
- The Fed’s New “Tightening” Plan Is Too Little, Too Late
- Keynesians and Market Monetarists Didn’t See Inflation Coming
From Elliott Wave University
- The Dow 8 Waves are Incomplete
- What to Make of the Stock Market’s Bounce
- Is the Correction Over Yet?
- Why Investors are Consistently Fooled by the Stock Market
- Is Bitcoin Headed to Zero?
From OptioMoney
- Financial Mistakes to Avoid After College
- Common Tax Mistakes That You Need To Avoid
- 6 Passive Income Ideas to Grow Your Wealth
- Surprising Ways a Storage Unit Can Save You Money
- Guide to Managing Small Business Finances
From Your Family Finances
- How to Retire in 7 Years
- Qualifying for a Car Loan
- 7 Ways to Cut Costs on Your Home Remodel Project
- The Financial Side of Your Dream Car
- Yearly Home Checkup: What To Look For

Leave a Reply