
The Bureau of Labor Statistics reported Another Record High Annual Inflation Rate in January.
Inflation Summary:
- Annual Inflation highest since February 1982.
- CPI Index rose from 278.802 to 281.148.
- Monthly Inflation for January was 0.84%
- The next release is on March 10th
Annual Inflation for the 12 months ending in January was 7.48%.
Jan. 2021- 1.40% — Jan 2022- 7.48%
2021 Inflation Rates
Feb 2021 1.68% — June 2021 5.39% — Dec. 7.04%
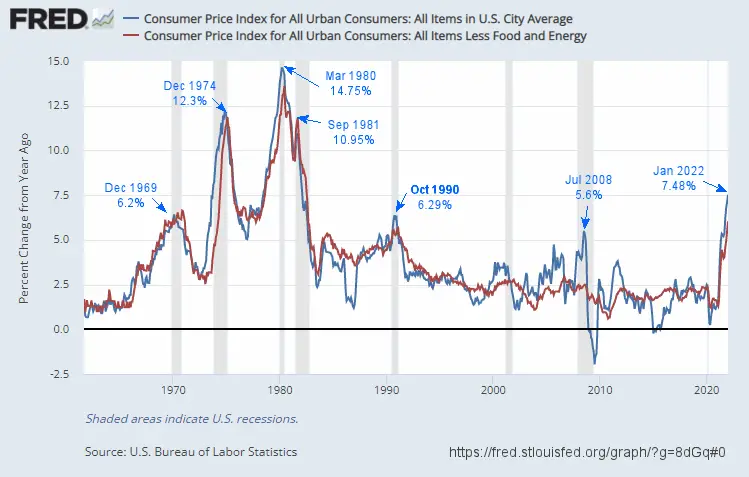
Inflation soared from January 2021 to January 2022 reaching an almost 40 year high. The last time inflation was higher was in February 1982 when it was 7.62% but then it was declining from the March 1980 peak of 14.76%.
As you can see from the chart below, current levels have exceeded the July 2008 peak of 5.6% and the October 1990 Peak of 6.29%.
 Click for Larger Image
Exactly 40 years ago, in January 1982, inflation had fallen to 8.39%, and a month later it was slightly above current levels. The main reason inflation was conquered was because Reagan was willing to take the hard steps necessary to control it. He tasked the FED with wringing inflation out of the system which resulted in a massive recession. If we look at the chart above it appears that there are two recessions, one in 1980 and another larger one a couple of years later. But an argument can be made that it was really just one big recession knocking inflation down from 14.76% in March 1980 to 2.46% in July of 1983. This was a politically risky thing to do, since most Presidents don’t voluntarily throw the economy into recession and it cost him a lot of political capital and some are still bitter about it today.
When we ask, How Quickly Can The FED Get Inflation Under Control today? we first have to ask if the current administration has the willpower to tackle the task and also do they have the political capital to accomplish it? Another unique component of today’s inflation situation is the tight labor market Former Treasury Secretary Larry Summers discusses.
The current FED has been spoiled by declining inflation rates since the 1980 peak, allowing them to print money almost at will. This is partly due to deflationary forces resulting from innovation in the Electronics/Computer/Internet area and partly due to competition from China driving down prices. See: How Nixon’s Revolutionary Move Influenced U.S. Inflation For 50 Years for more information.
BLS Commissioner’s Inflation Report:
The Consumer Price Index for All Urban Consumers (CPI-U) increased 0.6 percent in January on a seasonally adjusted basis, the U.S. Bureau of Labor Statistics reported today. Over the last 12 months, the all items index increased 7.5 percent before seasonal adjustment. Increases in the indexes for food, electricity, and shelter were the largest contributors to the seasonally adjusted all items increase. The food index rose 0.9 percent in January following a 0.5-percent increase in December. The energy index also increased 0.9 percent over the month, with an increase in the electricity index being partially offset by declines in the gasoline index and the natural gas index.
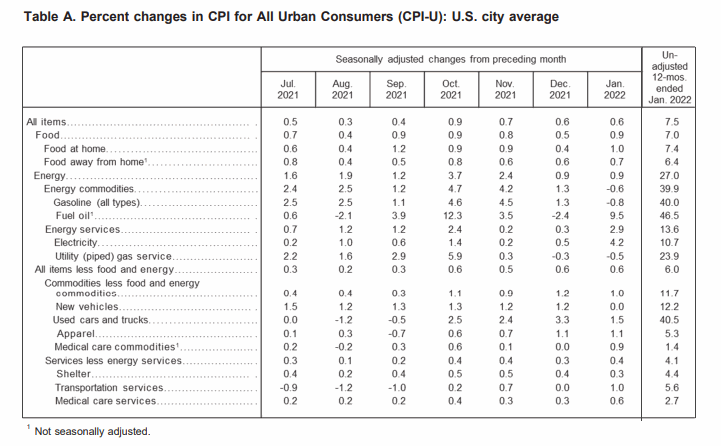
Of course, they round the inflation rate to a single decimal place, we prefer a bit finer view so we round it to 7.48%. The largest 12 month gainers were Energy specifically Fuel Oil at 46.5% and Used Vehicles at 40.5%.
Seasonally Adjusted Inflation Components Table
 Since we calculate the inflation rate to two decimal places, this month’s Annual Inflation was 7.48%, and monthly Inflation on a NON-Adjusted basis was 0.84%.
Critical components of January’s increase were Energy prices which increased 27% over the last year led by Fuel Oil prices which were up a whopping 46.5%. Those heating with fuel oil during this Winter season are being hit hardest. Used Cars and Trucks were also up 40.5% over year-ago prices. Food was up 7.0% over year-ago prices.
See: From Pandemic To 2021 Supply Chain Disruption for more information. We’ve also updated the Inflation Adjusted Crude Oil prices chart and Crude Oil Table.
January 2022 Inflation Situation
The Current Annual inflation Rate for the 12 months ending in January was 7.48%, up from 7.04% in December and more than 5 times last January’s 1.4% rate.
Monthly Inflation:
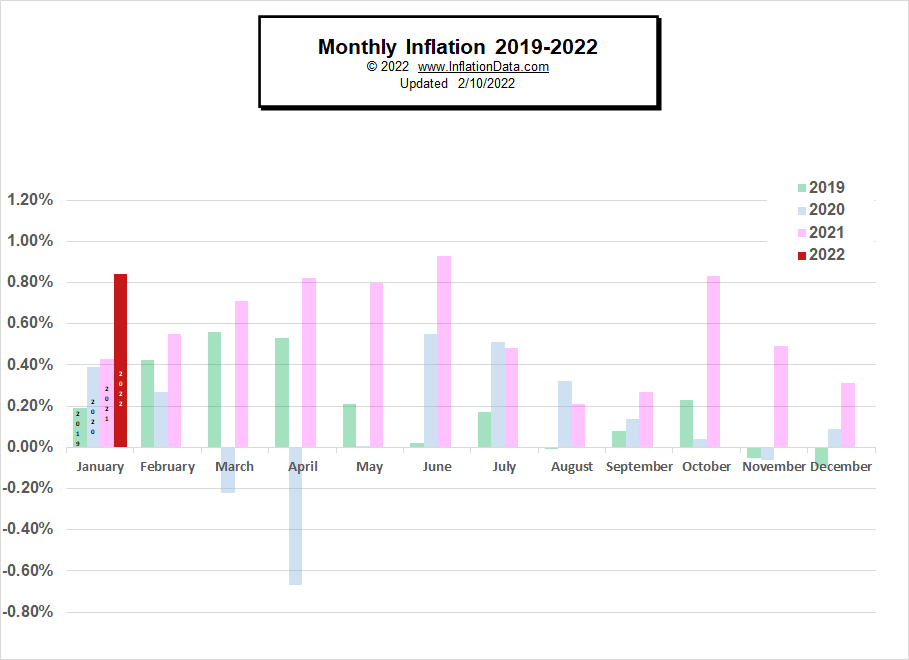
January 2021’s 0.43% was replaced by January 2022’s 0.84% increasing the Annual inflation rate from 7.04% to 7.48%. Typically, January through May have the highest monthly inflation and that held true in 2021. So it is possible that unless monthly inflation is really high for the next 5 months, annual inflation could be relatively flat.
Monthly inflation in 2021:
| January | February | March | April | May | June |
| 0.43% | 0.55% | 0.71% | 0.82% | 0.80% | 0.93% |
On the other hand, if monthly inflation rates stay at 0.84% for February through June, inflation would increase significantly in February and March, but April and May would only increase slightly, and June would actually decrease slightly. But typically June is much more moderate, so if June’s monthly inflation is only 0.44% instead of 0.84% annual inflation could drop by about ½%. See Moore Inflation Predictor’s Forecast for more information on current projections.
Click for Larger Image
See Annual Inflation for more information.
Not Seasonally Adjusted Monthly Inflation Rates
Note: January 2022’s 0.84% was the highest January since 1990.
| Jan | Feb | Mar | Apr | May | Jun | Jul | Aug | Sep | Oct | Nov | Dec | |
| 2016 | 0.17% | 0.08% | 0.43% | 0.47% | 0.41% | 0.33% | (0.16%) | 0.09% | 0.24% | 0.12% | (0.16%) | 0.03% |
| 2017 | 0.58% | 0.31% | 0.08% | 0.30% | 0.09% | 0.09% | (0.07%) | 0.30% | 0.53% | (0.06%) | 0.002% | (0.06%) |
| 2018 | 0.54% | 0.45% | 0.23% | 0.40% | 0.42% | 0.16% | 0.01% | 0.06% | 0.12% | 0.18% | (0.33%) | (0.32%) |
| 2019 | 0.19% | 0.42% | 0.56% | 0.53% | 0.21% | 0.02% | 0.17% | (0.01%) | 0.08% | 0.23% | (0.05%) | (0.09%) |
| 2020 | 0.39% | 0.27% | (0.22%) | (0.67%) | 0.002% | 0.55% | 0.51% | 0.32% | 0.14% | 0.04% | (0.06%) | 0.09% |
| 2021 | 0.43% | 0.55% | 0.71% | 0.82% | 0.80% | 0.93% | 0.48% | 0.21% | 0.27% | 0.83% | 0.49% | 0.31% |
| 2022 | 0.84% |
See: Monthly Inflation Rate for more information and a complete table of Unadjusted Monthly Rates.
Federal Reserve Actions
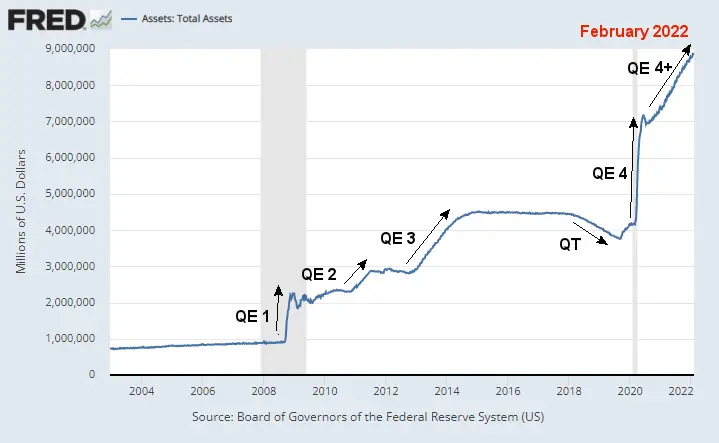
In April of 2020 in the midst of the COVID scare the FED went all out to fight deflation creating more liquidity than during QE 1 through QE 3. Then despite the rapid increase in Inflation, throughout 2021, the FED refused to admit that Inflation was going to be a problem and continued their QE money printing. See: Why Quantitative Easing is Inflationary… Sometimes. Finally, in December, the FED announced that it would begin tapering in January down to zero QE by March. This is not stepping on the brakes but simply letting off the gas. Looking at total assets, we can see the same stairstep pattern we’ve been seeing for the last year, but the steps are supposed to be smaller in January and February.
Click for Larger Image
However, just letting off the gas is enough to send the stock market into a tailspin since it is like a drug addict when it comes to QE. Cut off its supply, and it gets the shakes.
FED Funds Rate
So far, the FED has held the FED funds rate steady at a minuscule 8/100% (0.08%) from September through January.
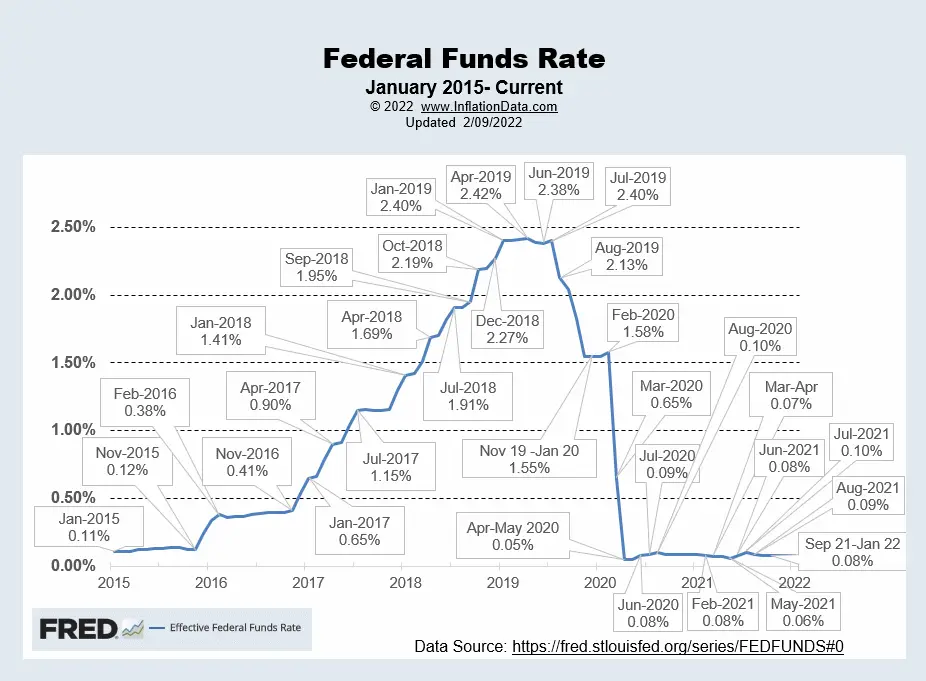 Chart Data Source St Louis FED.
For more info, See NYSE ROC and MIP.
Misery Index
Even though unemployment was down, Inflation was up more, so the Misery index increased.
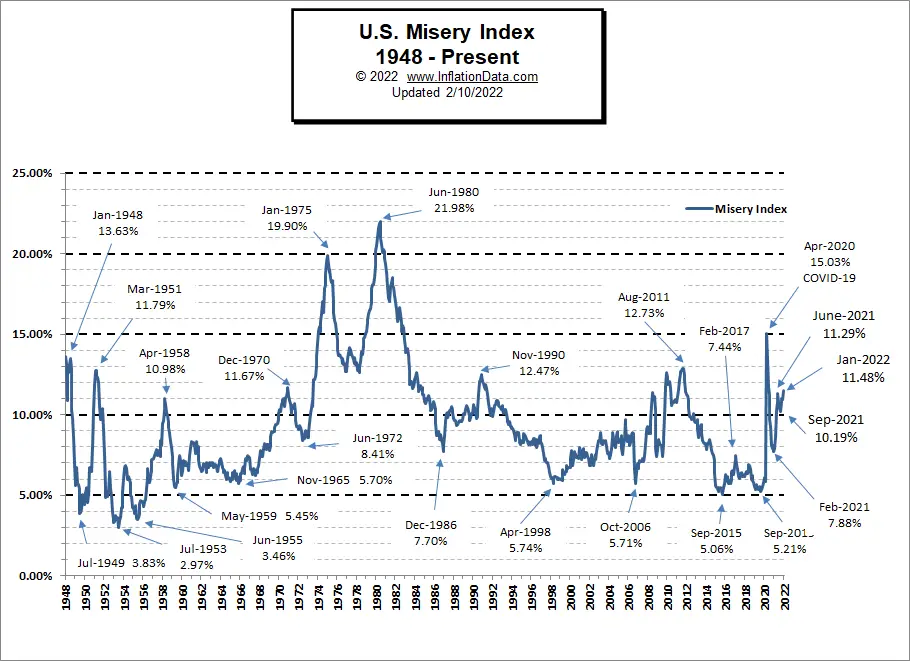
Click for Larger Image
[Read More…]
NYSE Rate of Change (ROC)©

Sell Signal
The NYSE ROC index is down below its moving average.
See the NYSE ROC for more info.
NASDAQ Rate of Change (ROC)©

Sell Signal
The NASDAQ ROC, down well below its moving average.
See NASDAQ ROC for more.
You Might Also Like:
From InflationData.com
- Former Treasury Secretary Larry Summers on the Current Inflation Situation
- How Quickly Can The FED Get Inflation Under Control?
- When Is Inflation Good for the Economy?
- December 2021 Inflation 5 Times as High as Last December
- Spoiler: The FED Guaranteed To Fight Inflation… Sooner Or Later
- Soaring Inflation Can Skyrocket Your Insurance Costs
- Why Quantitative Easing is Inflationary… Sometimes
- Millennials Have Never Seen Inflation This High
From UnemploymentData.com.
- January 2022 Unemployment Up not DOWN as Reported
- December Unemployment Rates by State
- Secure Careers That Don’t Require A Lot Of Education
- No Work Experience? Here Are Some Interesting Job Possibilities
From Financial Trend Forecaster
- NYSE ROC Chart
- NASDAQ ROC Chart
- What is Entity Extraction and Why Should You Care?
- Technology And The Semiconductor Chip Shortage
- Remarkably Quick And Easy Alternative House Building Methods
- How Blockchain’s Unique Innovations Can Prevent Money Remittance Scams
- Are 3D Printed Houses the Trend of the Future?
- Will 2022 Be the Year of Massive Social Media Upheaval?
- Metaverse vs. Multiverse- What are They? And Where are They Leading?
- Curing Cancer with T-Cells
- 5 Revolutionary Developments in the Financial Industry
- How Is Technology Affecting Global Trading Markets
From Elliott Wave University
- Warning: Mergers And Acquisitions Can Vaporize The Stock Market
- Is the Correction Over?
- Euro: Look at This Head & Shoulders Chart Formation
- Has Crypto-Mania Finally Run Its Course?
- Are Disease Outbreaks Market Indicators?
From OptioMoney.com
- Unlock The Benefits Of A Good Credit Score
- Buying A Home When You Are Already In Debt
- Top 10 Tasks Businesses Should Outsource in 2022
- 7 Unexpected Costs Of Moving To A New Home
- 4 Simple Growth Management Tips for Small Business Owners
From Your Family Finances
- How To Empower Your Financial Future With Realistic, Attainable Goals”
- 8 Secrets To Moving Overseas For Retirement
- Advice on What to Expect When Buying a Home
- Shortcuts To Building A Better Financial Future
- What to Look for in a New Insurance Company

Leave a Reply