
The Bureau of Labor Statistics reported that Annual Inflation fell from 7.75% in October to 7.11% in November 2022. This was down from a peak of 9.06% in June 2022.
Monthly inflation was negative (Disinflation) for November at -0.10%.
This is fairly typical for the fourth quarter, which is traditionally negative.
Monthly inflation for 2022 was lower than in November 2021 so Annual inflation fell.
It is important to remember that although the inflation RATE is falling… prices are still going up, i.e., prices are still 7% higher than they were a year ago. A decline from 7.75% to 7.11% is similar to a car going from 77 mph to 71 mph… it is still speeding forward just not quite as quickly. Although the car is slowing.
Inflation Summary:
- Annual Inflation fell from 7.75% to 7.11%
- CPI Index fell from 298.012 to 297.711
- Monthly Inflation for November was -0.10%
- Next release is January 12th 2023
Jan. 2021 — 1.40% | Jan. 2022 — 7.48% | Feb. 2022 — 7.87% | March 8.54% |
Apr. 2022 –8.26% | May 2022 — 8.58% | June 2022 — 9.06% | July 2022 — 8.56%% |
August 2022 — 8.26% | September — 8.20% | October — 7.75% | November — 7.11%
The stock market saw this as an encouraging event, and rallied but then gave up much of its gains.
BLS Inflation Report:
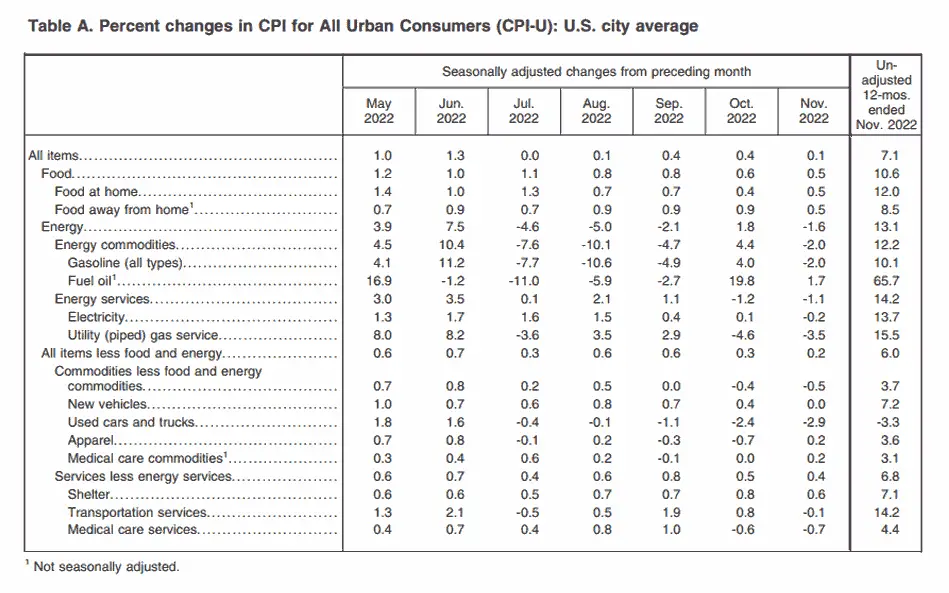
The BLS Commissioner reported, “The Consumer Price Index for All Urban Consumers (CPI-U) rose 0.1 percent in November on a seasonally adjusted basis, after increasing 0.4 percent in October, the U.S. Bureau of Labor Statistics reported today. Over the last 12 months, the all items index increased 7.1 percent before seasonal adjustment.
The index for shelter was by far the largest contributor to the monthly all-items increase, more than offsetting decreases in energy indexes. The food index increased 0.5 percent over the month, with the food at home index also rising 0.5 percent. The energy index decreased 1.6 percent over the month as the gasoline index, the natural gas index, and the electricity index all declined.
On an annual (non-adjusted) basis, inflation fell from 7.75% to 7.11%.
Food, shelter, and fuel oil ROSE, but overall energy fell. Used cars also helped bring down the CPI on a monthly basis but the only item that is actually lower than a year ago is used cars.
Monthly Inflation Compared to Previous Years:
At 0.84% (January), 0.91% (February), and 1.34% (March), monthly inflation was high even for the first quarter of the year, when monthly inflation is typically at its highest. Then, April, July, August, and September came in lower than 2021, helping to bring down the annual inflation rate. But monthly Inflation for June 2022 was 1.37%, the highest June since 1941.
Then July, August, and November were slightly negative, resulting in Disinflation. Of course, that is still a long way away from deflation.
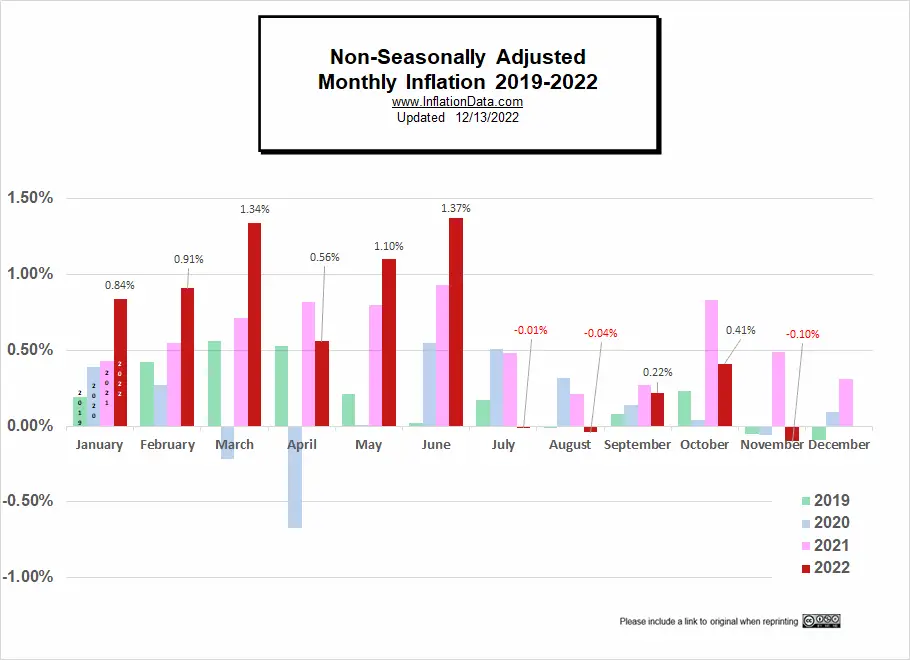
Not Seasonally Adjusted Monthly Inflation Rates
Note: January 2022’s 0.84% was the highest January since 1990. June was the highest June since 1941 (although the first quarter of 1980 had some higher rates). Typically, June is the beginning of lower monthly rates.
| Jan | Feb | Mar | Apr | May | Jun | Jul | Aug | Sep | Oct | Nov | Dec | |
| 2016 | 0.17% | 0.08% | 0.43% | 0.47% | 0.41% | 0.33% | (0.16%) | 0.09% | 0.24% | 0.12% | (0.16%) | 0.03% |
| 2017 | 0.58% | 0.31% | 0.08% | 0.30% | 0.09% | 0.09% | (0.07%) | 0.30% | 0.53% | (0.06%) | 0.002% | (0.06%) |
| 2018 | 0.54% | 0.45% | 0.23% | 0.40% | 0.42% | 0.16% | 0.01% | 0.06% | 0.12% | 0.18% | (0.33%) | (0.32%) |
| 2019 | 0.19% | 0.42% | 0.56% | 0.53% | 0.21% | 0.02% | 0.17% | (0.01%) | 0.08% | 0.23% | (0.05%) | (0.09%) |
| 2020 | 0.39% | 0.27% | (0.22%) | (0.67%) | 0.002% | 0.55% | 0.51% | 0.32% | 0.14% | 0.04% | (0.06%) | 0.09% |
| 2021 | 0.43% | 0.55% | 0.71% | 0.82% | 0.80% | 0.93% | 0.48% | 0.21% | 0.27% | 0.83% | 0.49% | 0.31% |
| 2022 | 0.84% | 0.91% | 1.34% | 0.56% | 1.10% | 1.37% | (0.01%) | (0.04%) | 0.22% | 0.41% | (0.10%) |
See: Monthly Inflation Rate for more information and a complete table of Unadjusted Monthly Rates.
Inflation Forecast
Looking back at our September Inflation projection, we can see that in the wake of the FED’s aggressive tightening and SPR oil releases, inflation is tracking our “extreme-low” projection. This is encouraging after their slow start earlier this year. Hopefully, they won’t overdo it to make up for the late start or quit too early, they have a very fine line to walk.
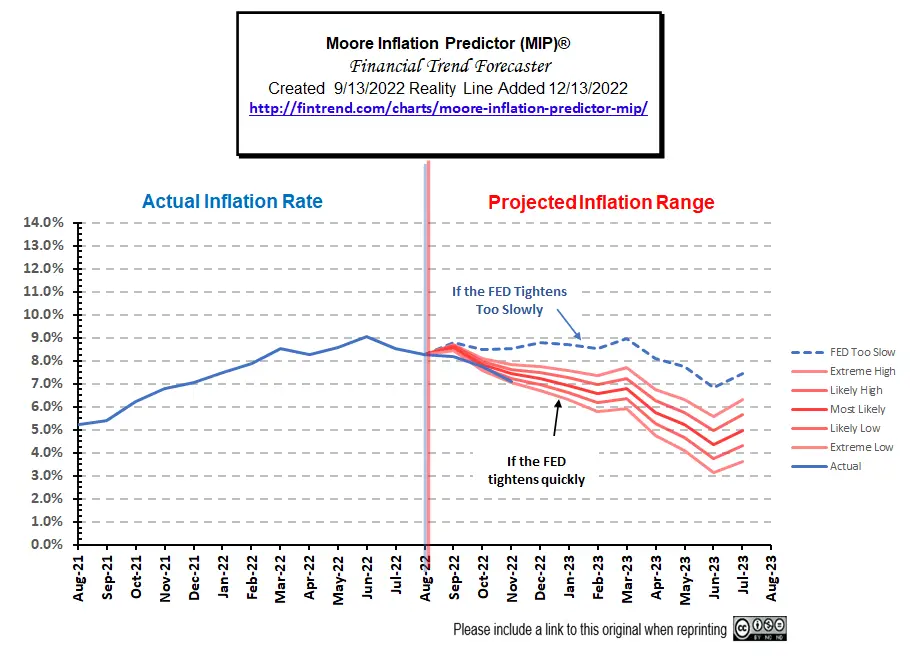 This month’s MIP shows some very interesting possibilities for next June and November.
See this month’s full MIP Chart and commentary here.
Inflation All Items vs. Core Inflation Chart
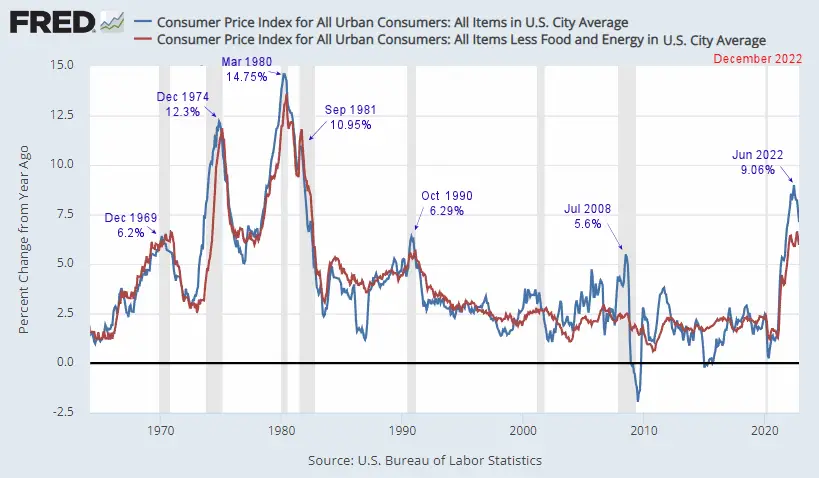
Looking at the chart above from the St. Louis FED, we can see the difference between inflation with food and energy and without. The red line shows the annual inflation rate minus food and energy. With the large gap between core inflation and total inflation, we can see that food and energy are a significant portion of total inflation. It is generally thought that food and energy are almost outside FED control, but core inflation is a monetary issue. Therefore, although food and energy are significant factors here, the vast majority of inflation can still be laid at the FED’s doorstep. And so far, despite the tight labor market, wage inflation has not kept up with price inflation, so the average consumer is worse off than a year ago. The only thing preventing severe financial pain is that the average household has much higher savings than they had prior to the pandemic. Before the pandemic, households held about $1 trillion in what was effectively cash, a figure that has ballooned to $4.7 trillion by the second quarter of this year.
Crude Oil
In an effort to keep oil prices low, the Biden administration has been draining the Strategic Petroleum Reserve (SPR), but that can’t continue forever. As we can see in the chart below, the current drawdown is significantly larger than any previous decline. Even the Desert Storm drawdown is dwarfed by the current drain.
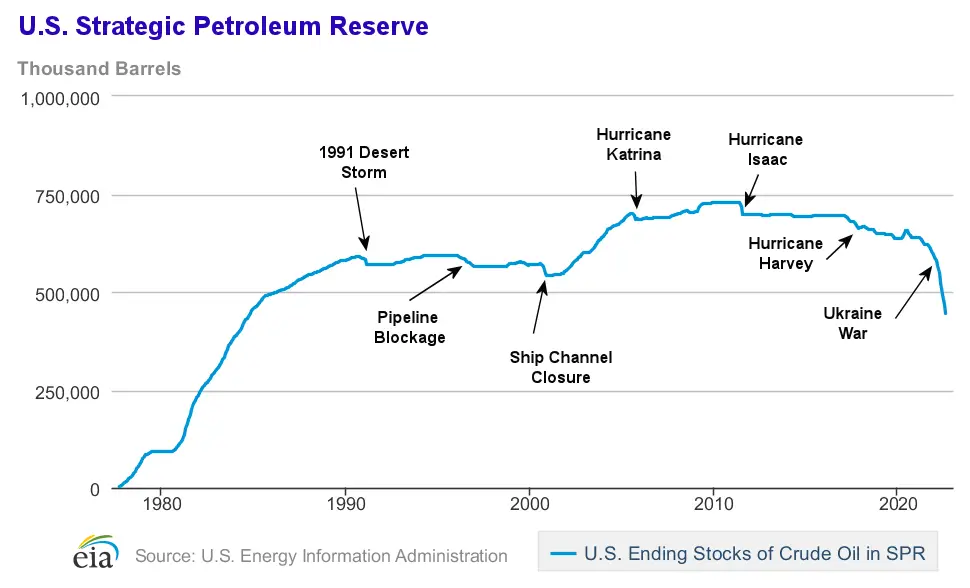
Read more and see historical Crude Oil prices here.
FED Assets
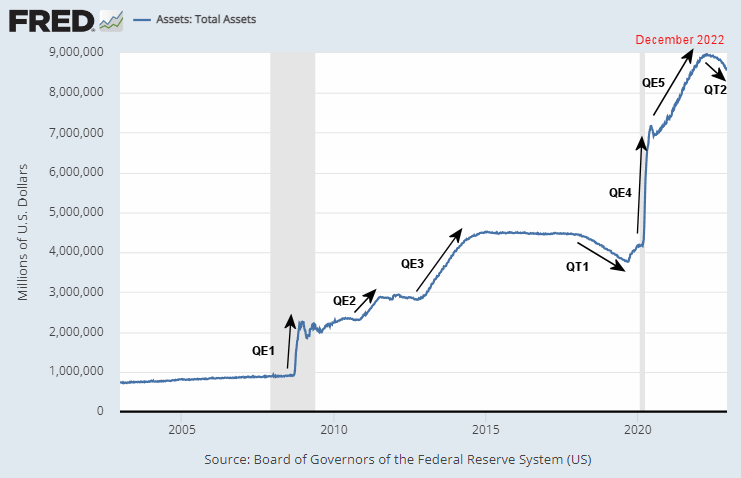
The FED’s total assets have started to decline a bit, but there is a long way to go to get back to 2019 levels, and that will involve a lot of economic pain, so the question is if the FED will chicken out before it gets there.
The FED’s Interest Rate Policy
The chart below shows that the FED has raised rates a full 3.7% from 0.08% in February to 3.78% in November, bringing levels above 2019 levels. But a healthy market requires interest rates higher than inflation rates in order to provide savers a “real” rate of return.
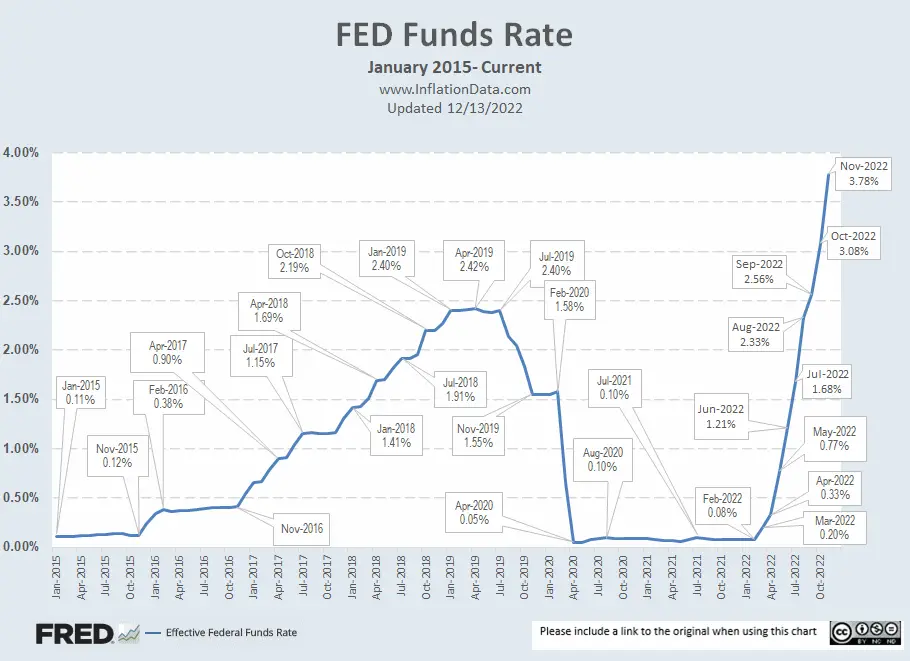
Looking at the longer-term chart, we can see that current levels are still low on a historical basis. Despite all the raising, prior to 2008, there are only a couple of instances where rates have been as low as they are now.
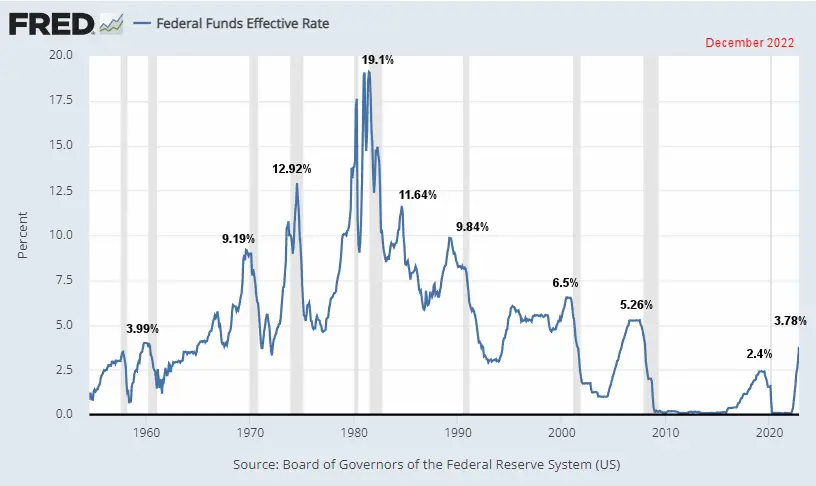
Chart Data Source St Louis FED.
For more info, See NYSE ROC and MIP.
Misery Index
Unemployment was up in October, and Inflation was down. The Misery index decreased slightly to levels very similar to January 2022.
| Unemployment | Inflation | Misery Index | |
| January 2022 | 4.0% | 7.48% | 11.48% |
| February 2022 | 3.8% | 7.87% | 11.67% |
| March 2022 | 3.6% | 8.54% | 12.14% |
| April 2022 | 3.6% | 8.26% | 11.86% |
| May 2022 | 3.6% | 8.58% | 12.18% |
| June 2022 | 3.6% | 9.06% | 12.66% |
| July 2022 | 3.5% | 8.52% | 12.02% |
| August 2022 | 3.7% | 8.26% | 11.96% |
| September 2022 | 3.5% | 8.2% | 11.70% |
| October 2022 | 3.7% | 7.75% | 11.45% |
| November 2022 | 3.7% | 7.11% | 10.81% |
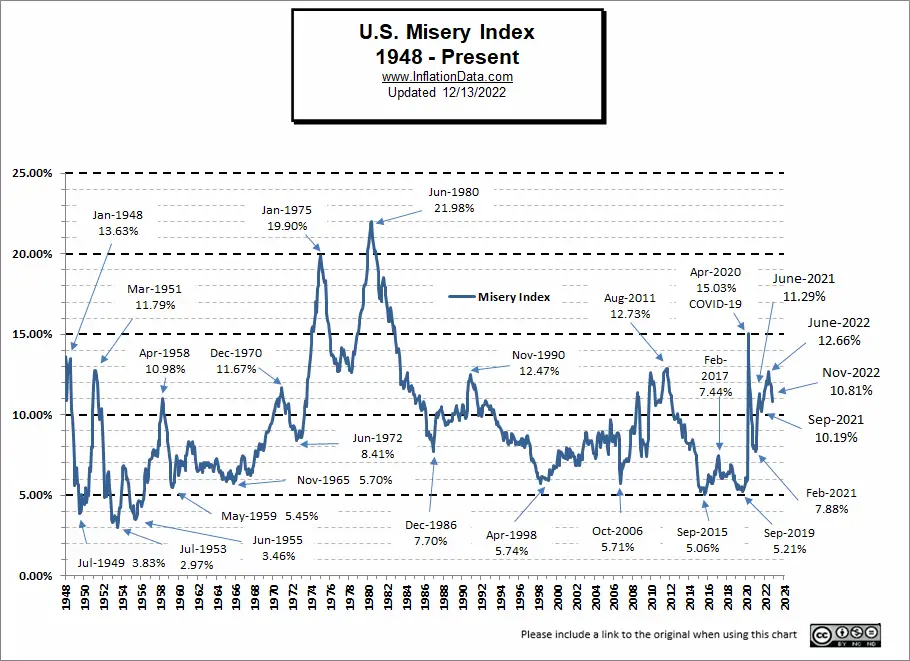
[Read More on the Misery Index…]
NYSE Rate of Change (ROC)©

Sell Signal
The NYSE ROC index is still WAY below its moving average.
See the NYSE ROC for more info.
NASDAQ Rate of Change (ROC)©

Sell Signal
The NASDAQ ROC remains well below its moving average too.
See NASDAQ ROC for more.
You Might Also Like:
From InflationData.com
- November Producer Price Index Declines from 2021 to 2022
- Gasoline Prices vs. Wages Over Time
- Can Businesses Really Set Any Price They Want?
- November FED Announcement Rocks Stock Market
- What is the Reverse Wealth Effect and Why Does the FED Want It?
From Financial Trend Forecaster
- NYSE ROC Chart
- NASDAQ ROC Chart
- Are Countries Getting Smaller?
- Is the U.S. Dollar Hegemony Ending?
- Latest Recession Alarm
- Housing Is Getting Less Affordable
- Are Housing Prices Set to Crash?
- Half-Way to the Stock Market’s Worst Case Scenario
- Don’t Fight the FED
- Will Loan Forgiveness Raise College Costs?
- Is The U.S. A Powerful “Empire” In Decline?
From UnemploymentData.com.
- 5 Career Opportunities for Disabled Individuals
- 4 Careers that Don’t Require a 4 Year Degree
- November Jobs Report
- Are You Eligible for Social Security Disability Benefits?
- Unemployment Rates by State October 2022
From Elliott Wave University
- U.S. Dollar: Has the Mainstream Been Way Too Confident?
- Banks Are Becoming More Cautious About Lending
- Are You Prepared for Widespread Bank Failures?
- Will Another “Great Depression” Start in Europe?
- Stocks Don’t Go Straight Up (or Straight Down)
From OptioMoney
- 6 Tips for Moving Out of Your Parent’s Home with No Money
- 5 Tips for Paying Off Your Debt
- Warning Signs You’re On the Road to Financial Catastrophe
- Money Habits That Can Help You Retire Early
- 7 Ways to Save Money When Living in a Big City
From Your Family Finances
- Questions to Ask When Hiring a Wealth Management Service
- 7 Tips for Comparing Moving Estimates
- Keys to Your Child’s Successful Financial Future
- How To Teach Your Teen Financial Literacy
- 4 Ways a Loan Modification Can Help You

Leave a Reply