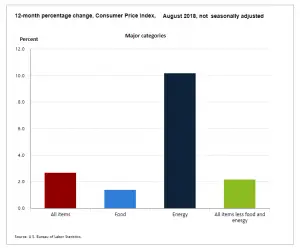
On September 13th 2018, the U.S. Bureau of Labor Statistics released their monthly Consumer Price Index report on the status of Inflation for the 12 months through the end of August. Annual Inflation is Down Annual inflation in August was 2.70% down from 2.95% in July and 2.87% in June. (BLS rounds both to 2.9%) CPI was 252.146 in August, 252.006 in July and 251.989 in June. Monthly Inflation for August was 0.06%, July was 0.01%, and June was 0.16% compared to 0.30% in August 2017. Next release October 11th Monthly Inflation: Annual inflation for the 12 months ending in August was 2.70%. 2.95% up from 2.87% in June. The U.S. Bureau of Labor Statistics (BLS) rounds … [Read more...]
July Inflation Up a Fraction
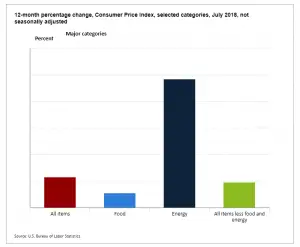
On August 10th 2018, the U.S. Bureau of Labor Statistics released their monthly Consumer Price Index report on the status of Inflation for the 12 months through the end of July. Annual Inflation is Up Very Slightly Annual inflation in July was 2.95% up slightly from 2.87% in June. (BLS rounds both to 2.9%) CPI was 252.006 in July and 251.989 in June. Monthly Inflation for July was 0.01%, and 0.16% in June compared to -0.07% in July 2017. Next release September 13th Monthly Inflation: Annual inflation for the 12 months ending in July was 2.95% up from 2.87% in June. The U.S. Bureau of Labor Statistics (BLS) rounds both to 2.9% and accordingly reports the inflation rate … [Read more...]
Annual Inflation Up Slightly in June
The U.S. Bureau of Labor Statistics released the Annual Inflation Rate data for the year through the end of June on July 12th 2018. Annual Inflation is Up Annual inflation rate was 2.87% in June up from 2.80% in May, 2.46% in April, 2.36% in March and 2.21% in February. CPI-U was 251.989 in June, 251.588 in May, 247.867 in January and 246.524 in December. Monthly Inflation for June was 0.16% while May was 0.42%, April was 0.40%, up from 0.23% in March 2018. June 2017 was only 0.09% Next release August 10th Monthly Inflation: Annual inflation for the 12 months ending in June was 2.87% up slightly from May's 2.80% but up sharply from April's 2.46%. Current levels are … [Read more...]
Debt and Inflationary Pressures: A Lesson in Economic Interactivity
Does debt cause inflation? If so what kind of debt? Personal debt? Government debt? Corporate debt? And what exactly is inflation? In this article, we will look at all these issues. Price Inflation occurs when the cost of a representative basket of goods and services is rising. The key factor is the general trend that takes place in an economy, it is possible that individual items such as foreign automobiles, the price of coffee, or corn could rise while other items that require a larger portion of your disposable income are falling (or vice versa). So the Bureau of Labor Statistics uses a "weighted basket of goods" i.e. they calculate what percentage of an average person's salary goes … [Read more...]
Annual Inflation Up Sharply in May
The U.S. Bureau of Labor Statistics released the Annual Inflation Rate data for the year through the end of May on June 12th 2018. Annual Inflation is Up Annual inflation rate was 2.80% in May up from 2.46% in April, 2.36% in March and 2.21% in February. CPI-U was 251.588 in May, 250.546 in April, 249.554 in March, 248.991 in February, 247.867 in January and 246.524 in December. Monthly Inflation for May was 0.42%, April was 0.40%, up from 0.23% in March 2018. May 2017 was only 0.09% Next release July 12th Monthly Inflation: Annual inflation for the 12 months ending in May was 2.80% up sharply from April's 2.46% the increase was primarily because May 2017's … [Read more...]
Inflation Risk
What is Inflation Risk? Inflation Risk aka. "Purchasing Power Risk" is the risk due to "a decrease in purchasing power of assets or cash flow" due to inflation. A typical example would be a bond that generates a fixed rate of return. For instance, suppose this bond is worth $1000 and generates a 5% yield i.e. $50. Suppose when you purchase the bond that $50 will buy two tanks of gas for your car. Over time inflation will reduce the purchasing power of that $50 so it only buys one tank of gas. If you are counting on using the proceeds of the bond to buy gas there is an "inflation risk" that eventually you will not be covered. The worst-case example of inflation risk is if a country … [Read more...]
March Inflation Data Released
The U.S. Bureau of Labor Statistics released the Annual Inflation Rate data for the year through the end of March on April 11th 2018. Annual Inflation is Up Annual inflation rate was 2.36% up from 2.21% in February. CPI was 249.554 in March, 248.991 in February, 247.867 in January and 246.524 in December. Monthly Inflation for March 2018= 0.23% Monthly Inflation for March 2017= 0.08% Next release May 10th Monthly Inflation: Typically the monthly inflation rate is highest during the first quarter (January through March) and lowest during the last quarter (October through December). March 2018 had 0.23% monthly inflation which was below February's 0.45% but it … [Read more...]
Monthly Inflation Spikes in August
The U.S. Bureau of Labor Statistics released the Annual Inflation Rate data for the year ending in August on September 14th 2017. Annual inflation was 1.94% in August up from 1.73% in July. CPI-U 245.519 Monthly Inflation for August 0.30% Next release October 18th According to the U.S. Bureau of Labor Statistics (BLS) - "Increases in the indexes for gasoline and shelter accounted for nearly all of the seasonally adjusted increase in the all items index. The energy index rose 2.8 percent in August as the gasoline index increased 6.3 percent. The shelter index rose 0.5 percent in August with the rent index up 0.4 percent. The food index rose slightly in August, with the … [Read more...]
July CPI Down But Inflation Up
The Bureau of Labor Statistics Released the Inflation Data for the Year ending in July on August 11th. Annual inflation was 1.73% in July - Up from 1.63% in June, but down from 1.87% in May, 2.20% in April, 2.38% in March, 2.74% in February, and 2.50% in January. CPI 244.786 in July down from CPI 244.955 in June Monthly Inflation for July -0.07%, June 0.09%, May 0.09%, April was 0.30%, March was 0.08%, February was 0.31% and 0.58% in January. Next release September 14th The reason the CPI went down but inflation went up is because July 2016 monthly inflation was -0.16% and this July was less negative. So CPI goes down for the month but not as much as last year so Annual … [Read more...]
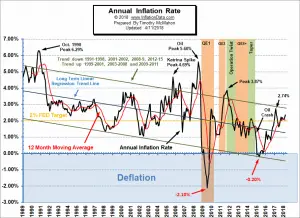
Inflation 1.63% in June
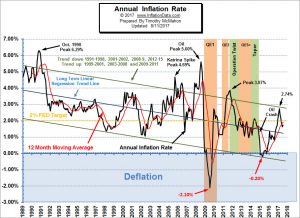
The U.S. Bureau of Labor Statistics released the Annual Inflation Rate data for the year ending in June on July 14th 2017. Annual inflation was 1.63% in June - down from 1.87% in May, 2.20% in April, 2.38% in March, 2.74% in February, and 2.50% in January. June CPI-U 244.955-- May CPI-U 244.733 Monthly Inflation for June 0.09%, May 0.09%, April was 0.30%, March was 0.08%, February was 0.31% and 0.58% in January. Next release August 11th Annual Inflation Chart Annual inflation for the 12 months ending in June 2017 was 1.63% down from 1.87% in May, 2.20% in April, 2.38% in March, 2.74% in February and 2.50% in January. The annual cyclical low was 0.84% in July 2016. The … [Read more...]
