
The U.S. Bureau of Labor Statistics CPI report released on April 10th, showed Annual Inflation was up from 3.2% in February to 3.5% in March.
(but since we calculate it to two digits, it was actually 3.15% in February and 3.48% in March.)
Monthly inflation was 0.62% in February and 0.65% in March. Typically inflation is highest in the first quarter of the year, so these numbers are a bit high but not that unusual. In March 2023 monthly inflation was 0.33%, so annual inflation jumped in 2024. Mr. Market didn’t like the news because it drastically reduced the chances of a rate cut anytime soon. So, stocks fell on the release. The NYSE opened at 18,171.20 and that was the high for the day. It closed down almost 224 points or 1.2%. As of this writing, declines are continuing the next day.
Although we projected a moderate increase for March, you can see from our MIP projection from last month, inflation was above the high end of our range. Indicating, that inflation pressure still exists.
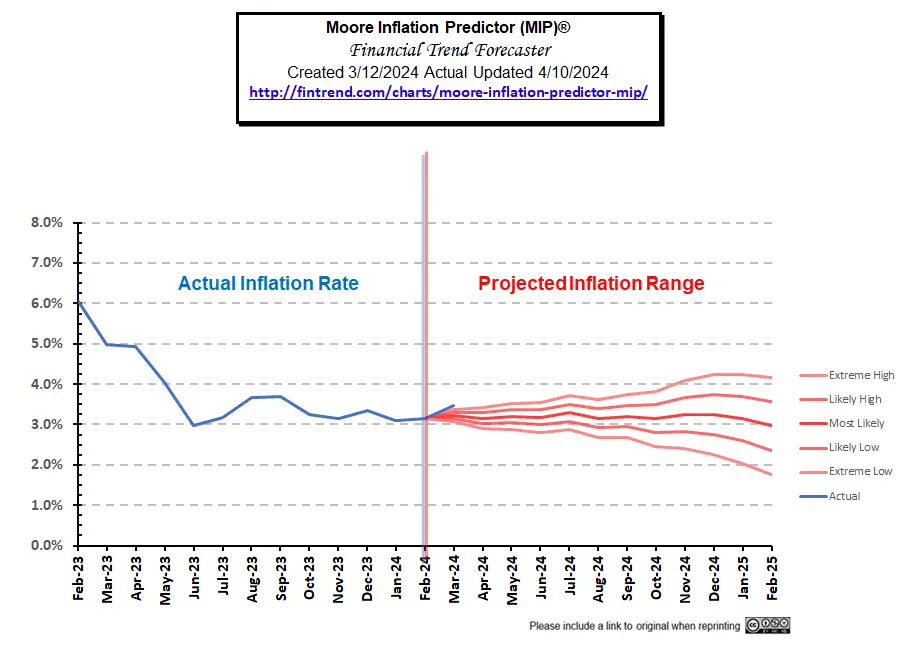 Go here to view our current MIP projection.
March 2024 Inflation Summary:
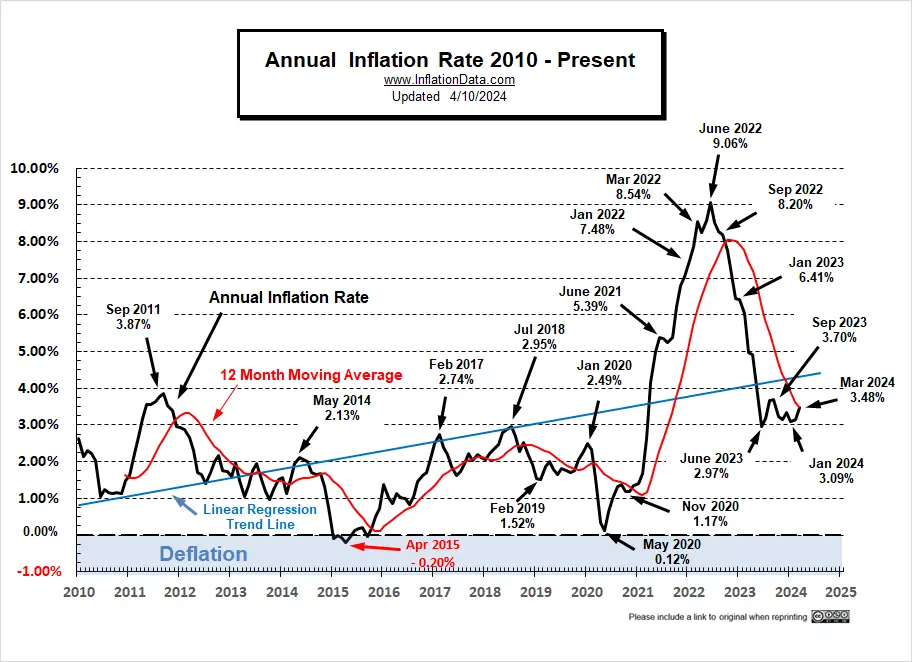
- Annual Inflation rose from 3.15% to 3.48%
- CPI Index rose from 310.326 to 312.332
- Monthly Inflation for March was 0.65%
- Next release May 15th 2024
| Jan | Feb | Mar | Apr | May | June | July | Aug | Sep | Oct | Nov | Dec | |
| 2022 | 7.48% | 7.87% | 8.54% | 8.26% | 8.58% | 9.06% | 8.52% | 8.26% | 8.20% | 7.75% | 7.11% | 6.45% |
| 2023 | 6.41% | 6.04% | 4.98% | 4.93% | 4.05% | 2.97% | 3.18% | 3.67% | 3.70% | 3.24% | 3.14% | 3.35% |
| 2024 | 3.09% | 3.15% | 3.48% |
BLS Commentary:
The BLS Commissioner reported:
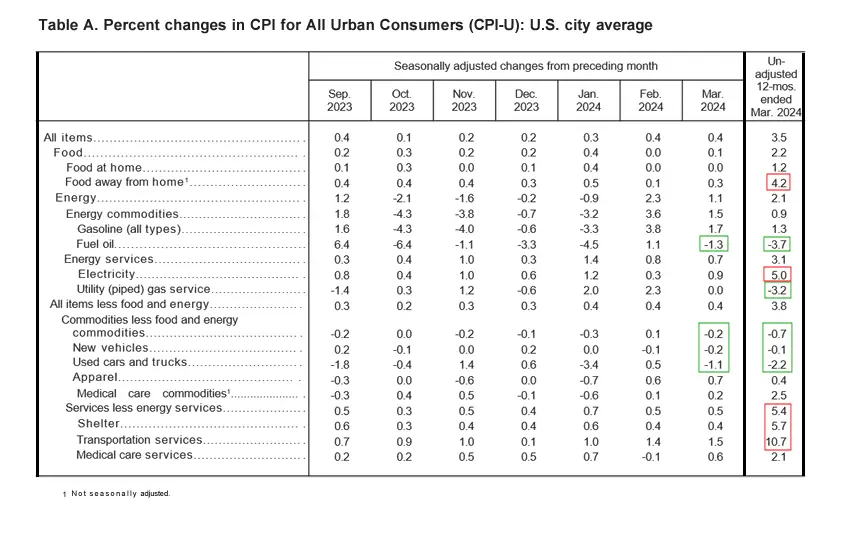
“The Consumer Price Index for All Urban Consumers (CPI-U) increased 0.4 percent in March on a seasonally adjusted basis, the same increase as in February, the U.S. Bureau of Labor Statistics reported today. Over the last 12 months, the all items index increased 3.5 percent before seasonal adjustment.
The index for shelter rose in March, as did the index for gasoline. Combined, these two indexes contributed over half of the monthly increase in the index for all items. The energy index rose 1.1
percent over the month. The food index rose 0.1 percent in March. The food at home index was unchanged, while the food away from home index rose 0.3 percent over the month.”
Looking at table A below we can see that on an annual basis energy is still down but on a monthly basis it is up fairly significantly. The biggest gainers on an annual basis were Services like Food away from home, shelter and transportation services
Although these “Seasonally Adjusted” numbers are slightly different than those presented by the BLS, the following chart from the Federal Reserve shows the gap between inflation with and without Food and Energy. Comparing the two we can see how much food and energy are contributing toward overall inflation.
If the blue line is above the red line, food and energy, are adding to the overall inflation rate. But if blue is below the red line, they are actually mitigating overall inflation. As the blue line rose toward the red line from June through August, we noted that energy was doing less to keep down overall inflation. But in October through January gas prices were falling helping to drag down overall inflation. Inflation less food and energy is 3.8% up from 3.76% last month.
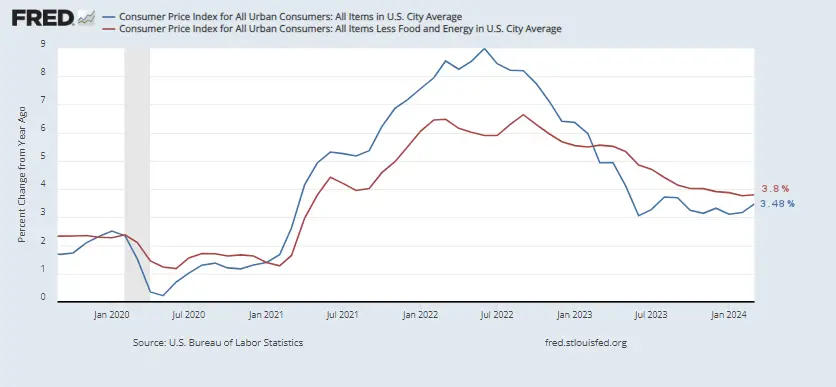
Source: St. Louis FED
Energy Prices
Overall energy prices have been down over the last year because the government was flooding the market with cheap oil by depleting our strategic petroleum reserves. But at some point, they have to replace those reserves (perhaps at much higher prices). Note: Reserves would have started at much higher levels had Democrats not refused Trump’s request to increase reserves when oil was cheap.
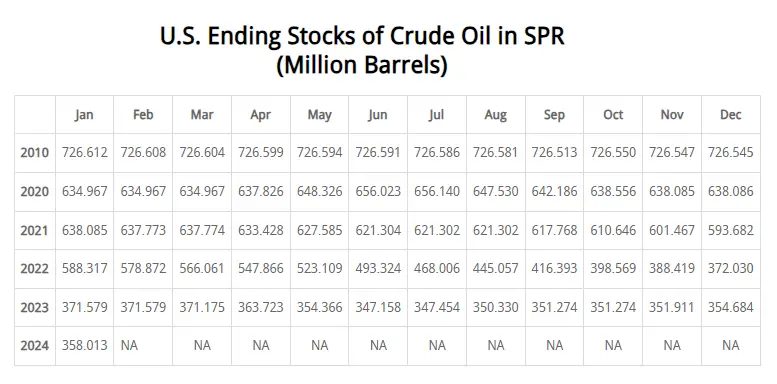
This chart from the U.S. EIA shows the extent of the recent strategic petroleum reserve drawdown compared to those of Desert Storm, various hurricanes, and other supply disruptions. Unfortunately, the E.I.A. is always a couple of months behind in updating its chart. But with the data we have we can see that the recent draw-down dwarfs all of the others combined. In July 2020, the SPR stood at 656,140,000 barrels.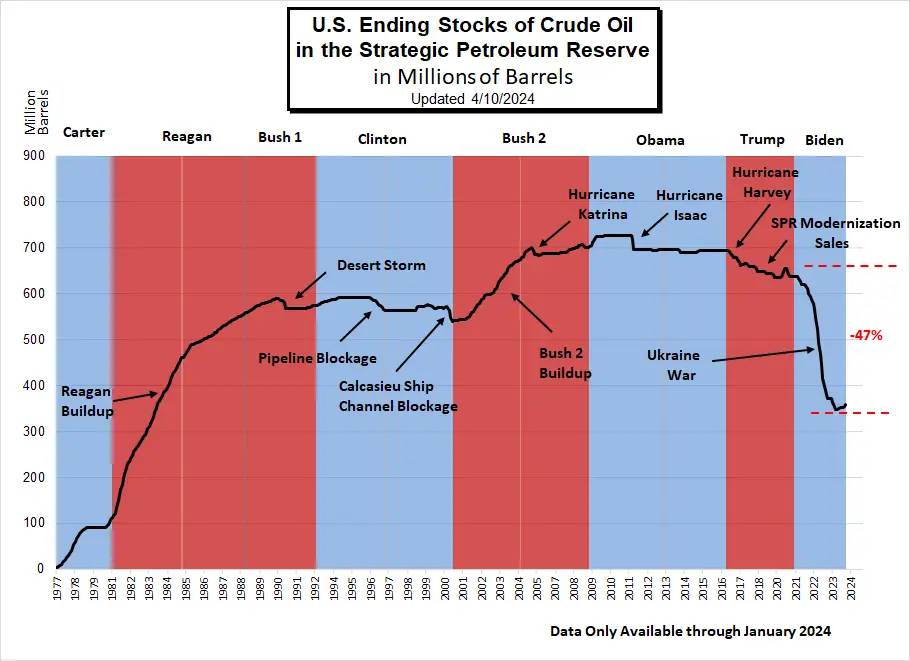 As of June 2023, the SPR was down to 347.158 million or roughly -47.1% below July 2020 levels, which were already below 2010 levels. From January to February, levels were unchanged, so we were hoping that they had halted the drawdown, but drawdowns continued through June. By September there was a slight increase to 351.274 million and it has shown a minuscule increase through January 2024 to 358.013 million (the most recent data available).
Note: Section 404 of the Bipartisan Budget Act of 2015 authorizes the Secretary of Energy to draw down and sell up to $2 billion of SPR crude oil, for fiscal years (FY) 2017 through 2020, to carry out an SPR modernization program.
EIA Data History of SPR Releases
Inflation Chart
Monthly Inflation Compared to Previous Years:
The monthly inflation rate for February 2024 was 0.62%.
In the chart below, we can see how the monthly inflation compares between 2018 (light green), 2019 (light blue), 2020 (pink), 2021 (purple), 2022 (orange), 2023 (dark), 2024 (teal). Interestingly, January 2018 and January 2024 are identical. But February 2024 is slightly higher than in 2023 and March is significantly higher. Since April 2023 was higher than March 2023, if April 2024 comes in the same as March 2024 we will still see an increase but not as significant as we saw this month.
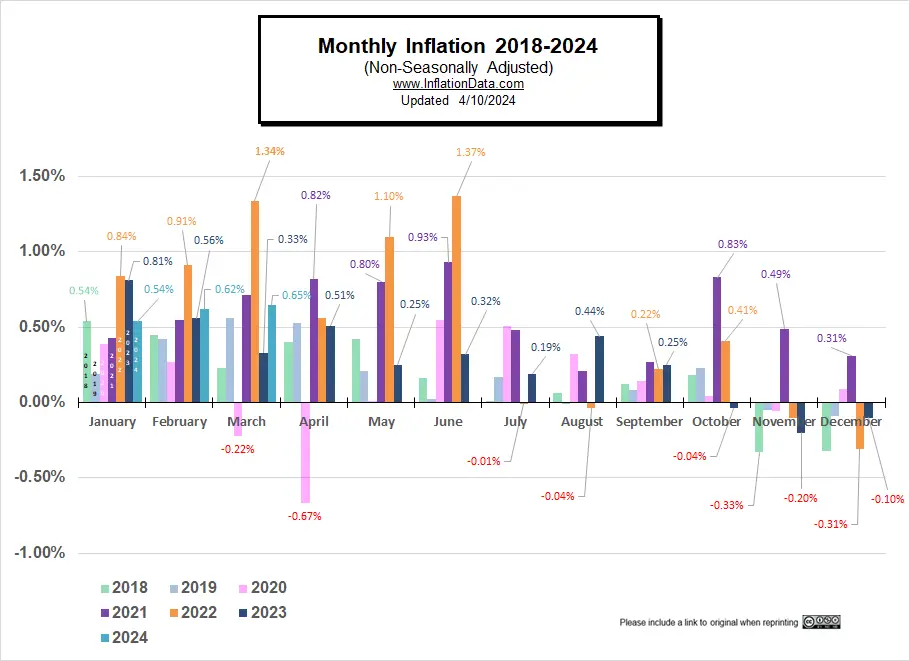
Not Seasonally Adjusted Monthly Inflation Rates
Note: January 2022’s 0.84% was the highest January since 1990. June was the highest June since 1941 (although the first quarter of 1980 had some higher rates). Typically, the first quarter has the highest monthly inflation and the 4th quarter is the lowest (even negative).
| Jan | Feb | Mar | Apr | May | Jun | Jul | Aug | Sep | Oct | Nov | Dec | |
| 2016 | 0.17% | 0.08% | 0.43% | 0.47% | 0.41% | 0.33% | (0.16%) | 0.09% | 0.24% | 0.12% | (0.16%) | 0.03% |
| 2017 | 0.58% | 0.31% | 0.08% | 0.30% | 0.09% | 0.09% | (0.07%) | 0.30% | 0.53% | (0.06%) | 0.002% | (0.06%) |
| 2018 | 0.54% | 0.45% | 0.23% | 0.40% | 0.42% | 0.16% | 0.01% | 0.06% | 0.12% | 0.18% | (0.33%) | (0.32%) |
| 2019 | 0.19% | 0.42% | 0.56% | 0.53% | 0.21% | 0.02% | 0.17% | (0.01%) | 0.08% | 0.23% | (0.05%) | (0.09%) |
| 2020 | 0.39% | 0.27% | (0.22%) | (0.67%) | 0.002% | 0.55% | 0.51% | 0.32% | 0.14% | 0.04% | (0.06%) | 0.09% |
| 2021 | 0.43% | 0.55% | 0.71% | 0.82% | 0.80% | 0.93% | 0.48% | 0.21% | 0.27% | 0.83% | 0.49% | 0.31% |
| 2022 | 0.84% | 0.91% | 1.34% | 0.56% | 1.10% | 1.37% | (0.01%) | (0.04%) | 0.22% | 0.41% | (0.10%) | (0.34%) |
| 2023 | 0.80% | 0.56% | 0.33% | 0.51% | 0.25% | 0.32% | 0.19% | 0.44% | 0.25% | (0.04%) | (0.20%) | (0.10%) |
| 2024 | 0.54% | 0.62% | 0.65% |
See: Monthly Inflation Rate for more information and a complete table of Unadjusted Monthly Rates.
Misery Index
Current Misery Index: Unemployment 3.8% + Inflation 3.48% = 7.28%
Unemployment was down 0.1% but inflation was up 0.33%.
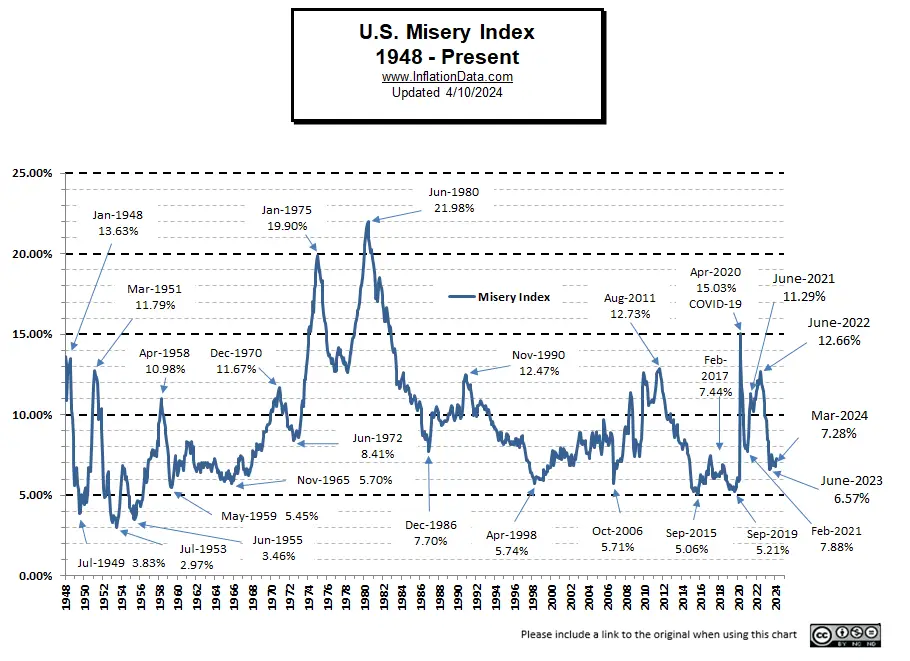
[Read More on the Misery Index…]
NASDAQ Rate of Change (ROC)
The NASDAQ dipped down from last month while the NYSE exhibited some more cautionary signs.
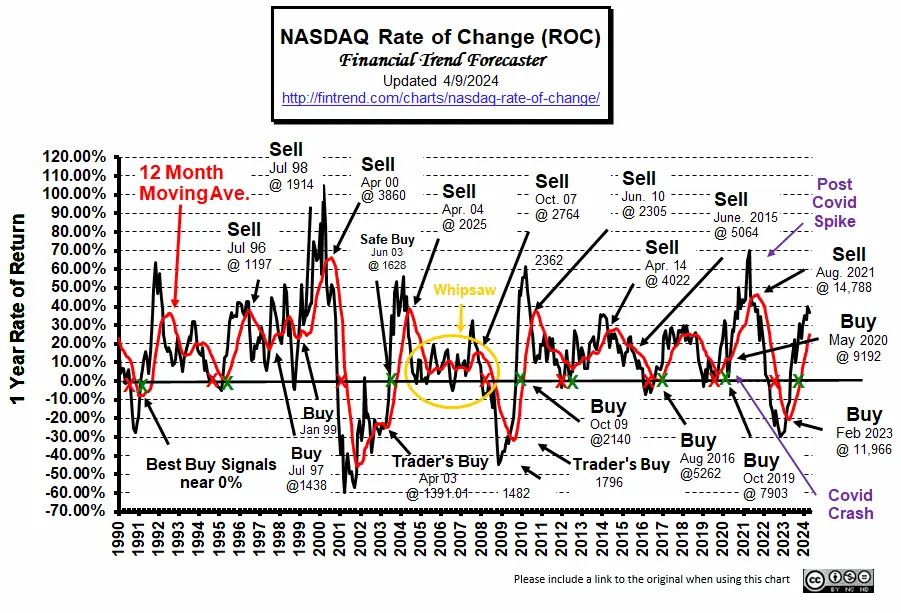
For more information, see NYSE Rate of Change (ROC) and NASDAQ ROC Chart.
You Might Also Like:
From InflationData.com
- Hyperinflation- How a Trickle Can Turn into a Flood
- Inflation, High Inflation, and Hyperinflation
- Industries Most Affected by Inflation: Insights from the Global Supply Chain
- Have Wages Kept Up with Inflation in 2023?
- Not All Prices Have Inflated Since 1964
- Worldwide Inflation by Country in 2023
From Financial Trend Forecaster
- Moore Inflation Predictor
- NYSE ROC
- NASDAQ ROC
- Global Debt Levels Are a Ticking Time Bomb
- America’s Fiscal Collapse Accelerates
- Crypto 2.0, A Whole New Ballgame
- California’s Latest Hustle: Utility Bills Based on Ratepayers’ Income
- The Barbarous Relic Rides Again
- Argentina Sees First Monthly Budget Surplus in 12 Years
- Federal Student Loans Drive Up College Tuition Levels
- America’s Fiat Money Gestapo: The Untold History of the Secret Service
- Argentina Mulls Dollarization- What is it?
From UnemploymentData.com.
- March 2024 Employment Higher Than Expected
- Exploring the Benefits of a Career in Truck Driving
- Cranes in Construction: A Sky-High Opportunity for Entrepreneurs
- Preparing for a Career in Medicine: What You Need to Know
- How to Create a Car Hauling Business
From Elliott Wave University
- Bob Prechter on the Rich Dad Radio Show
- A.I. Revolution and NVDA: Why Tough Going May Be Ahead
- Free report: ‘Gold Investors’ Survival Guide’
- U.S. Real Estate: A 24% Problem
- Update on China’s Big Housing Bust
From OptioMoney
- What are “Moving Loans” and Do You Need One?
- Navigating Currency Exchange: Maximizing Your Money When Moving Abroad
- The True Cost of Neglect: How Deferred Home Maintenance Creates Money Pits
- Financial Factors to Consider When Relocating Your Business
- Nomad Living: Managing Finances for a Mobile Lifestyle
From Your Family Finances
- Understanding SR22 Insurance: What Is It and Do You Need It?
- Moving into a Smaller Space? Here are 17 Clever Downsizing Tips to Know
- Helping Your Kids Learn Safe Ways To Invest Profitably
- Maximizing Your Home’s Value
- 7 Things You Need to Know Before Owning a Ranch

Leave a Reply