
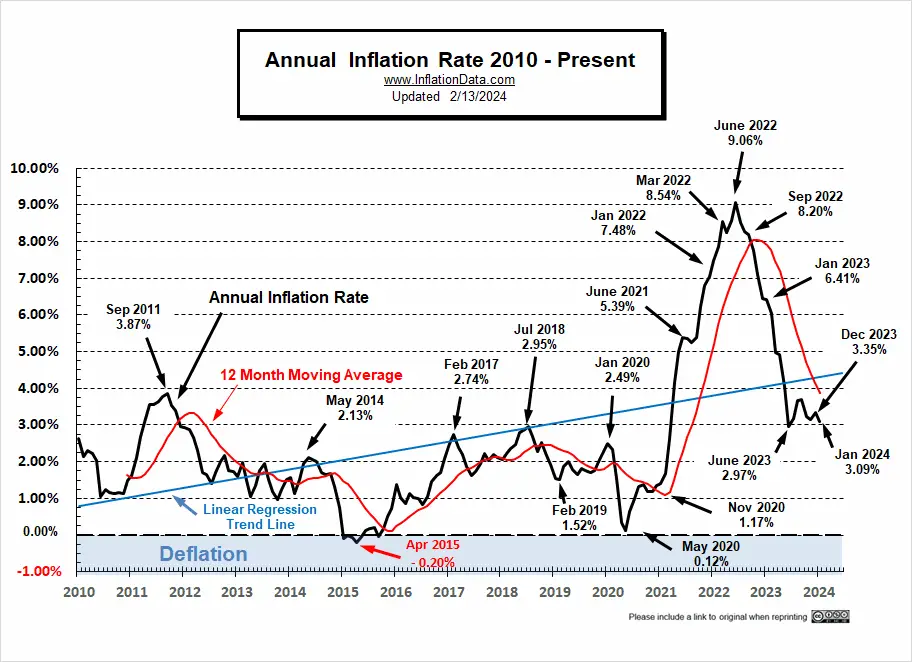
According to the Bureau of Labor Statistics CPI report released on February 13th, Annual Inflation was down to 3.1% in January from 3.4% in December.
(but since we calculate it to two digits, it was actually 3.09% in January and 3.35% in December.)
Monthly inflation was -0.10% in December and 0.54% in January. But since inflation is highest in the first quarter of the year, these numbers are not unusual. But in January 2023 monthly inflation was 0.80%, so annual inflation is lower in 2024. The BLS’s Seasonally adjusted monthly rate for January was 0.30%, the same as December 2023.
As you can see from our MIP projection from last month, inflation was at the high end of our range. Indicating, that despite annual inflation declining monthly inflation is still high.
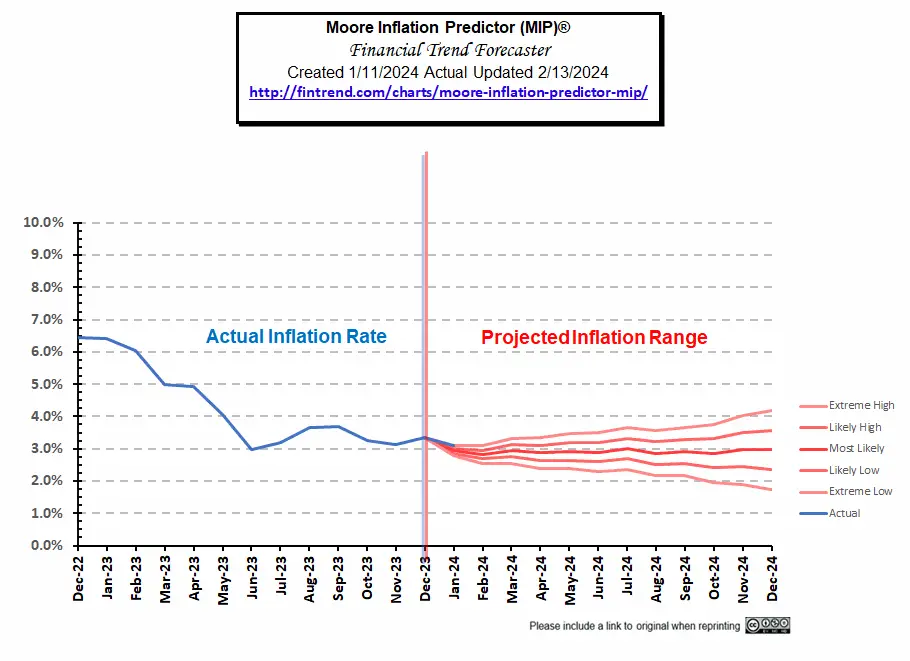 Go here to view our current MIP projection.
January 2024 Inflation Summary:
- Annual Inflation fell from 3.35% to 3.09%
- CPI Index rose from 306.746 to 308.417
- Monthly Inflation for January was 0.54%
- Next release March 12th 2024
| Jan | Feb | Mar | Apr | May | June | July | Aug | Sep | Oct | Nov | Dec | |
| 2022 | 7.48% | 7.87% | 8.54% | 8.26% | 8.58% | 9.06% | 8.52% | 8.26% | 8.20% | 7.75% | 7.11% | 6.45% |
| 2023 | 6.41% | 6.04% | 4.98% | 4.93% | 4.05% | 2.97% | 3.18% | 3.67% | 3.70% | 3.24% | 3.14% | 3.35% |
| 2024 | 3.09% |
BLS Commentary:
The BLS Commissioner reported:
The Consumer Price Index for All Urban Consumers (CPI-U) increased 0.3 percent in January on a seasonally adjusted basis, after rising 0.2 percent in December, the U.S. Bureau of Labor Statistics reported today. Over the last 12 months, the all items index increased 3.1 percent before seasonal adjustment.
The index for shelter continued to rise in January, increasing 0.6 percent and contributing over two thirds of the monthly all items increase. The food index increased 0.4 percent in January, as the food at home index increased 0.4 percent and the food away from home index rose 0.5 percent over the month.
In contrast, the energy index fell 0.9 percent over the month due in large part to the decline in the gasoline index.
Although, monthly inflation rose 0.3% on a seasonally adjusted basis on a non-adjusted basis it rose 0.54%.
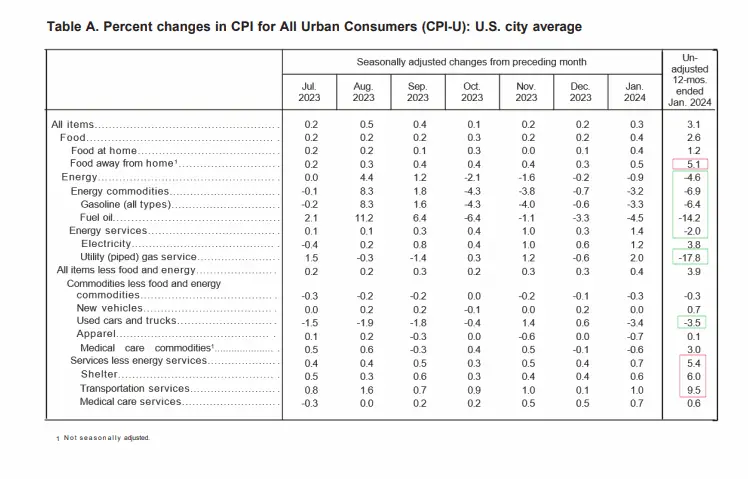
As we can see from the table below Energy declined over the year (green box) while the big increases came from the service sector and Food away from home which incidentally is simultaneously both a product and a service.
Although these “Seasonally Adjusted” numbers are slightly different than those presented by the BLS, the following chart from the Federal Reserve shows the gap between inflation with and without Food and Energy. Comparing the two we can see how much food and energy are contributing toward overall inflation.
If the blue line is above the red line, food and energy, are adding to the overall inflation rate. But if blue is below the red line, they are actually mitigating overall inflation. As the blue line rose toward the red line from June through August, we noted that energy was doing less to keep down overall inflation. But in October through January gas prices were falling helping to drag down overall inflation. If it wasn’t for falling energy prices inflation would be 3.87% down from 3.91% in December.
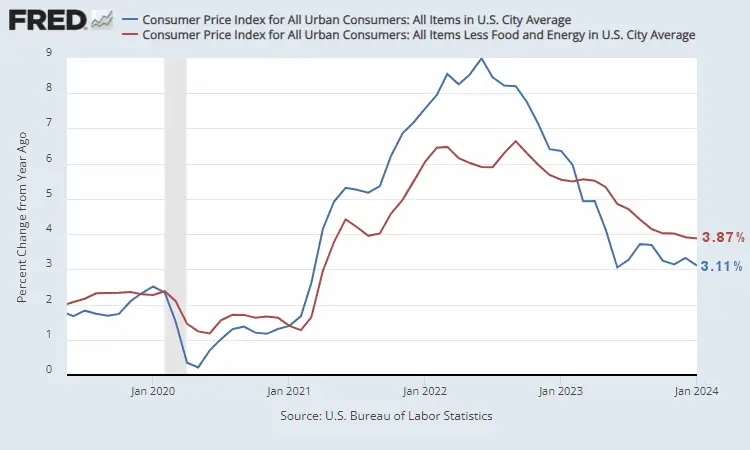
Source: St. Louis FED
Energy Prices
Overall energy prices have been down over the last year because the government has been flooding the market with cheap oil by depleting our strategic petroleum reserves. But at some point, they are going to have to replace those reserves (perhaps at much higher prices). Note: Reserves would have started at much higher levels had Democrats not refused Trump’s request to increase reserves when oil was cheap.
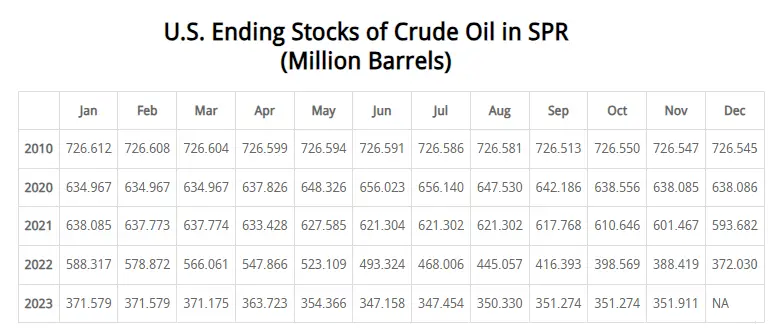
This chart from the U.S. EIA shows the extent of the recent strategic petroleum reserve drawdown compared to those of Desert Storm, various hurricanes, and other supply disruptions. Unfortunately, the E.I.A. is always a couple of months behind in updating its chart. But with the data we have we can see that the recent draw-down dwarfs all of the others combined. In July 2020, the SPR stood at 656,140,000 barrels.
As of June 2023, the SPR was down to 347.158 million or roughly -47.1% below July 2020 levels, which were already below 2010 levels. From January to February, levels were unchanged, so we were hoping that they had halted the drawdown, but drawdowns continued through June. By September there was a slight increase to 351.274 million where it remained in October with a slight increase in November to 351.911 million (the most recent data available).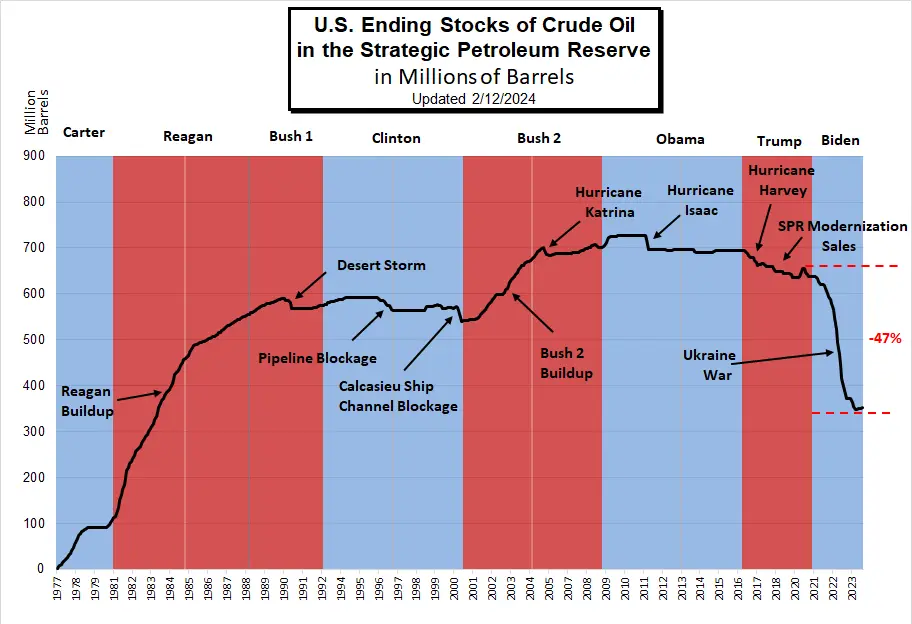
Note: Section 404 of the Bipartisan Budget Act of 2015 authorizes the Secretary of Energy to draw down and sell up to $2 billion of SPR crude oil, for fiscal years (FY) 2017 through 2020, to carry out an SPR modernization program.
EIA Data History of SPR Releases
Inflation Chart
Monthly Inflation Compared to Previous Years:
The monthly inflation rate for January 2024 was 0.54%.
In the chart below, we can see how the monthly inflation compares between 2018 (light green), 2019 (light blue), 2020 (pink), 2021 (purple), 2022 (orange), 2023 (dark), 2024 (teal). Interestingly, January 1018 and January 2024 are identical. We can hope that the rest of 2024 follows 2018’s lead and results in an average inflation for the year of 2.44%.
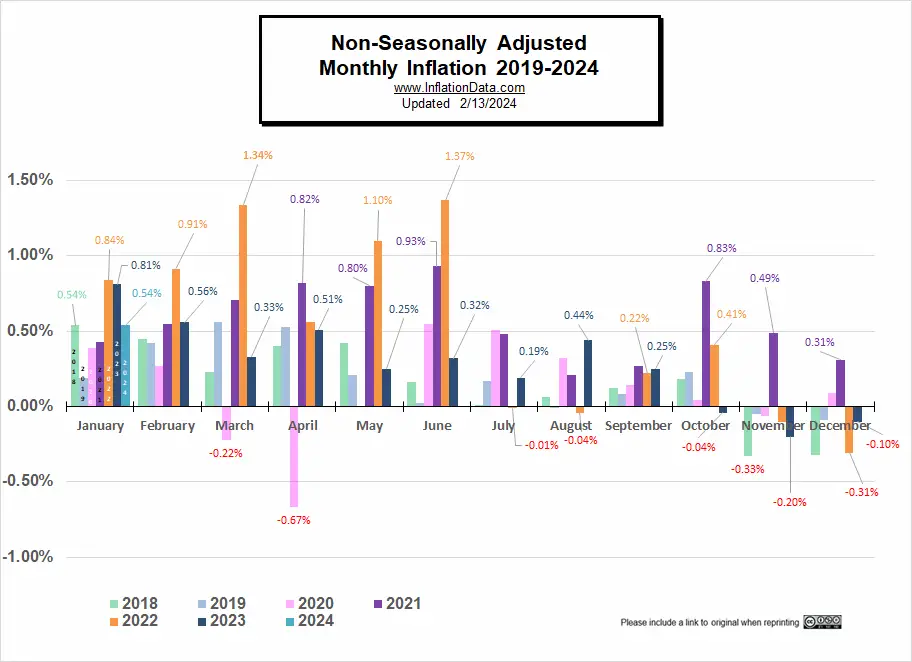
Not Seasonally Adjusted Monthly Inflation Rates
Note: January 2022’s 0.84% was the highest January since 1990. June was the highest June since 1941 (although the first quarter of 1980 had some higher rates). Typically, June is the beginning of lower monthly rates.
| Jan | Feb | Mar | Apr | May | Jun | Jul | Aug | Sep | Oct | Nov | Dec | |
| 2016 | 0.17% | 0.08% | 0.43% | 0.47% | 0.41% | 0.33% | (0.16%) | 0.09% | 0.24% | 0.12% | (0.16%) | 0.03% |
| 2017 | 0.58% | 0.31% | 0.08% | 0.30% | 0.09% | 0.09% | (0.07%) | 0.30% | 0.53% | (0.06%) | 0.002% | (0.06%) |
| 2018 | 0.54% | 0.45% | 0.23% | 0.40% | 0.42% | 0.16% | 0.01% | 0.06% | 0.12% | 0.18% | (0.33%) | (0.32%) |
| 2019 | 0.19% | 0.42% | 0.56% | 0.53% | 0.21% | 0.02% | 0.17% | (0.01%) | 0.08% | 0.23% | (0.05%) | (0.09%) |
| 2020 | 0.39% | 0.27% | (0.22%) | (0.67%) | 0.002% | 0.55% | 0.51% | 0.32% | 0.14% | 0.04% | (0.06%) | 0.09% |
| 2021 | 0.43% | 0.55% | 0.71% | 0.82% | 0.80% | 0.93% | 0.48% | 0.21% | 0.27% | 0.83% | 0.49% | 0.31% |
| 2022 | 0.84% | 0.91% | 1.34% | 0.56% | 1.10% | 1.37% | (0.01%) | (0.04%) | 0.22% | 0.41% | (0.10%) | (0.34%) |
| 2023 | 0.80% | 0.56% | 0.33% | 0.51% | 0.25% | 0.32% | 0.19% | 0.44% | 0.25% | (0.04%) | (0.20%) | (0.10%) |
| 2024 | 0.54% |
See: Monthly Inflation Rate for more information and a complete table of Unadjusted Monthly Rates.
Misery Index
Current Misery Index: Unemployment 3.7% + Inflation 3.09% = 6.79%
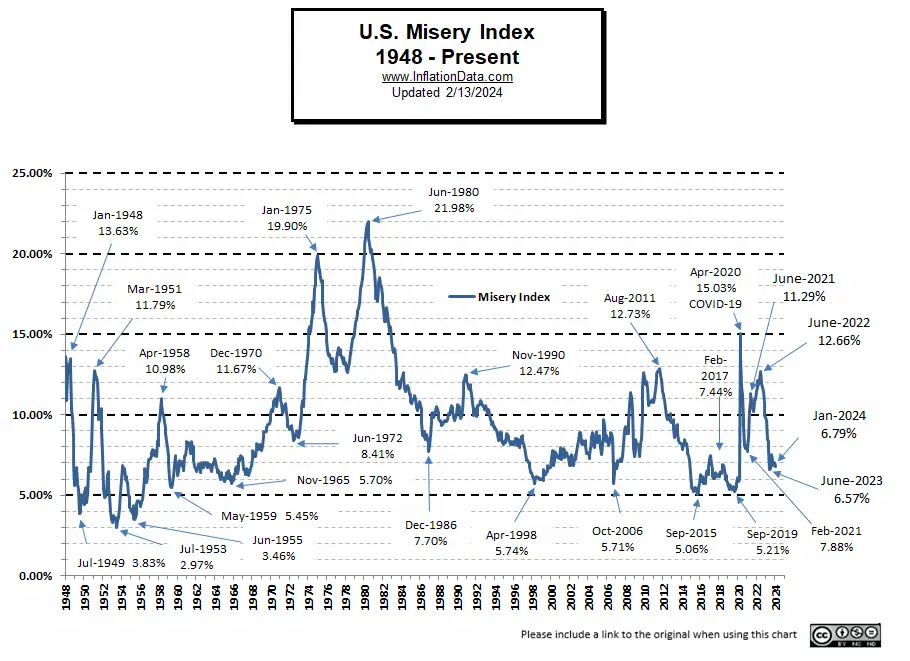
[Read More on the Misery Index…]
NASDAQ Rate of Change (ROC)
The NASDAQ continues roaring ahead but down slightly from last month.
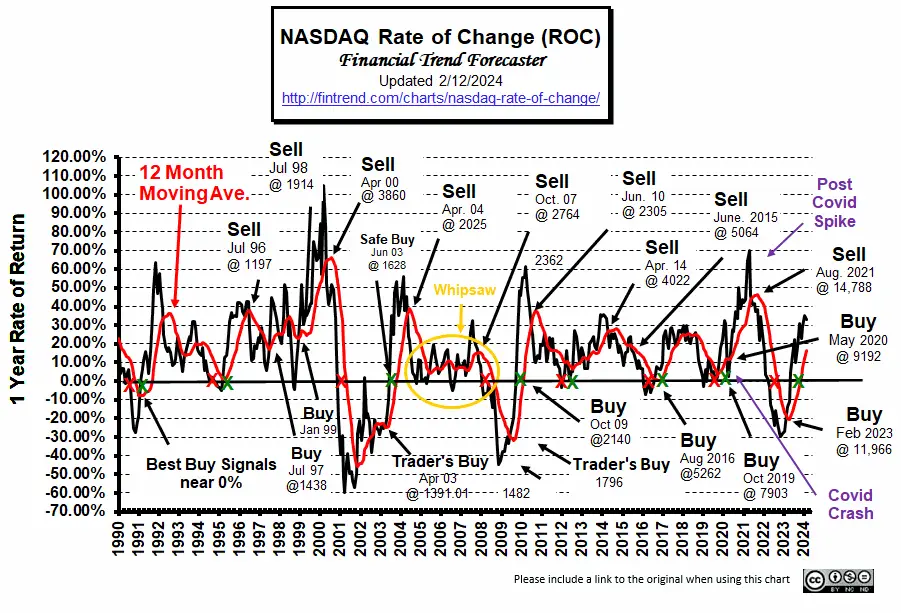
For more information, see NYSE Rate of Change (ROC) and NASDAQ ROC Chart.
You Might Also Like:
From InflationData.com
- Not All Prices Have Inflated Since 1964
- Industries Most Affected by Inflation: Insights from the Global Supply Chain
- Have Wages Kept Up with Inflation in 2023?
- Inflationary Expectations Do Not Cause Inflation
From Financial Trend Forecaster
- Moore Inflation Predictor
- NYSE ROC
- NASDAQ ROC Chart.
- Federal Student Loans Drive Up College Tuition Levels
- America’s Fiat Money Gestapo: The Untold History of the Secret Service
- Argentina Mulls Dollarization- What is it?
- The Fed Is Draining Our Economy Like Farmers Have Drained Their Aquifers
- If the Economy Is So Great, Why Are Tax Revenues So Weak?
From UnemploymentData.com.
- January Employment Declines, Adjusted Unemployment Flat
- Veterans Wanted | 6 Trades Veterans Can Excel In
- Find Your Calling: Fantastic Career Ideas in the Medical Field
- How to Make a Living as a Sound Engineer
- December Unemployment Unchanged
From Elliott Wave University
- U.S. Real Estate: A 24% Problem
- Update on China’s Big Housing Bust
- Mini-Manias: Beware Short-Term Trading Frenzies – Like This One
- Why You Should Expect a Once-in-a-Lifetime Debt Crisis
- Why Do Traders Really Lose Money?
- Quick Takes on Big Financial Trends
From OptioMoney
- The True Cost of Neglect: How Deferred Home Maintenance Creates Money Pits
- Financial Factors to Consider When Relocating Your Business
- Nomad Living: Managing Finances for a Mobile Lifestyle
- Financial Resilience in Uncertain Times
- Moving Abroad on a Budget:
From Your Family Finances
- Budgeting for Insurance When You Live Near Natural Disasters
- Debt Consolidation Made Simple
- Emergency Funds 101: Why Everyone Needs a Financial Safety Net
- Questions To Ask When Choosing a Bankruptcy Attorney
- Estate Planning: How to Prevent Family Arguments over Your Assets
- Tips for Adapting Your Budget to Urban or Rural Living After Moving
- Why Leasing is a Giant Rip-Off (and When it’s Not)
- Keep Your Home Trash-Free with these 5 Easy Habits
- Thriving on a Single Income

Leave a Reply