
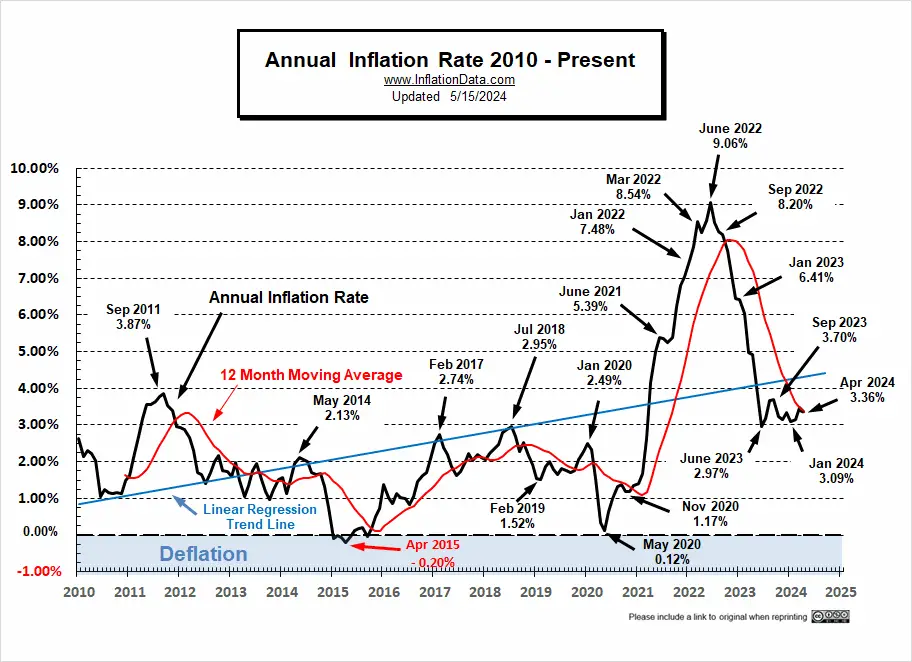
The U.S. Bureau of Labor Statistics released its April Inflation report on May 15th showing Annual Inflation was down from 3.5% in March to 3.4% in April.
(but since we calculate it to two digits, it was actually 3.48% in March and 3.36% in April.)
The markets took this as a good sign and the NYSE rallied 157.68 points resulting in a 0.87% gain. The NASDAQ did even better gaining 231.21 points or 1.40%. Prior to the gain, our NASDAQ ROC was flashing a warning signal. But we did say that we needed to wait for confirmation before selling.
Unadjusted monthly inflation was 0.65% in March which moderated sharply to “only” 0.39% in April. Typically inflation is highest in the first quarter of the year, so these numbers are still a bit high but not that unusual. In March 2023 monthly inflation was 0.33%, so annual inflation jumped in 2024. But April 2023 was 0.51% so annual inflation fell. Interestingly, May 2023 was 0.25% so if we get another month exactly like April (at 0.39%) rather than falling, annual inflation will rise.
The actual decrease was at the low end of our projected range, i.e., between our “extreme low” and “likely low” numbers.
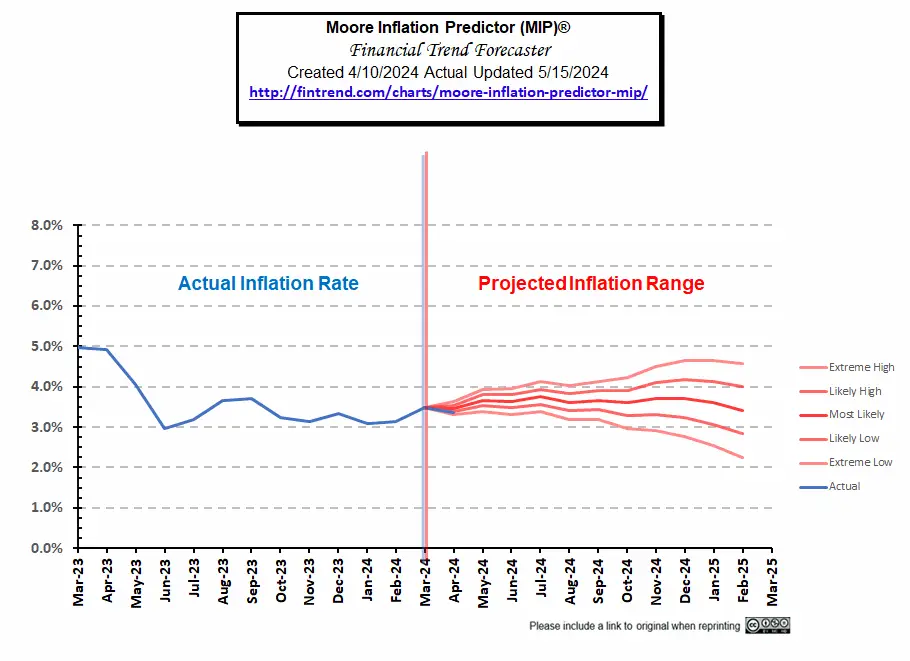 Go here to view our current MIP projection.
April 2024 Inflation Summary:
- Annual Inflation fell from 3.48% to 3.36%
- CPI Index rose from 312.332 to 313.548
- Monthly Inflation for April was 0.39%
- Next release June 12th 2024
| Jan | Feb | Mar | Apr | May | June | July | Aug | Sep | Oct | Nov | Dec | |
| 2022 | 7.48% | 7.87% | 8.54% | 8.26% | 8.58% | 9.06% | 8.52% | 8.26% | 8.20% | 7.75% | 7.11% | 6.45% |
| 2023 | 6.41% | 6.04% | 4.98% | 4.93% | 4.05% | 2.97% | 3.18% | 3.67% | 3.70% | 3.24% | 3.14% | 3.35% |
| 2024 | 3.09% | 3.15% | 3.48% | 3.36% |
BLS Commentary:
The BLS Commissioner reported:
“The Consumer Price Index for All Urban Consumers (CPI-U) increased 0.3 percent in April on a seasonally adjusted basis, after rising 0.4 percent in March, the U.S. Bureau of Labor Statistics reported today. Over the last 12 months, the all items index increased 3.4 percent before seasonal adjustment.
The index for shelter rose in April, as did the index for gasoline. Combined, these two indexes contributed over seventy percent of the monthly increase in the index for all items. The energy index rose 1.1 percent over the month. The food index was unchanged in April. The food at home index declined 0.2 percent, while the food away from home index rose 0.3 percent over the month.
The index for all items less food and energy rose 0.3 percent in April, after rising 0.4 percent in each of the 3 preceding months. Indexes which increased in April include shelter, motor vehicle insurance, medical care, apparel, and personal care. The indexes for used cars and trucks, household furnishings and operations, and new vehicles were among those that decreased over the month.”
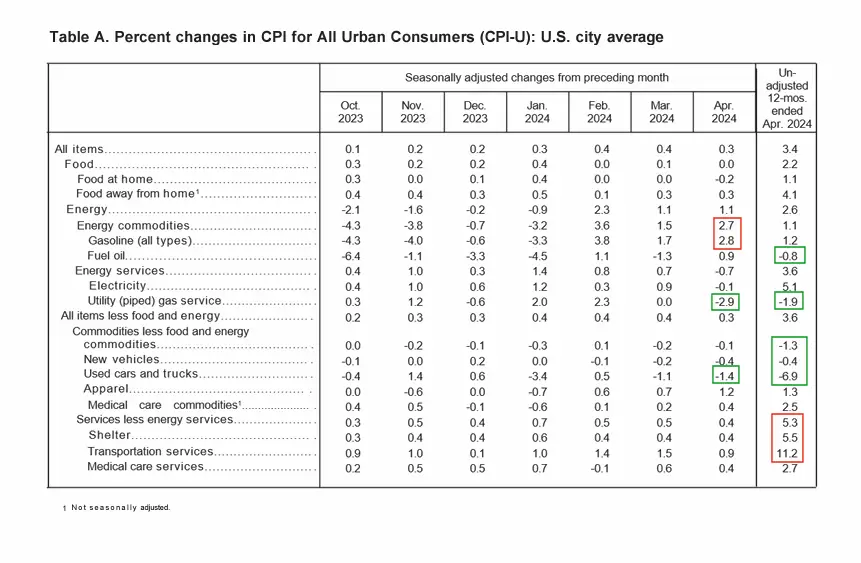
Looking at table A below we can see that on an annual basis energy is mixed this month Energy Commodities and Gasoline up 2.7% and 2.8% respectively while Utility (Piped) Gas is down -2.9%.
On an annual basis Services like Food away from home, shelter and transportation services were up while most commodities (other than food and electricity) were down.
Although these “Seasonally Adjusted” numbers are slightly different than those presented by the BLS, the following chart from the Federal Reserve shows the gap between inflation with and without Food and Energy. Comparing the two we can see how much food and energy contribute toward overall inflation.
If the blue line is above the red line, food and energy, add to the overall inflation rate. But if blue is below the red line, they are actually mitigating overall inflation. As the blue line rose toward the red line from June through August, we noted that energy was doing less to keep down overall inflation. But in October through January gas prices were falling helping to drag down overall inflation.
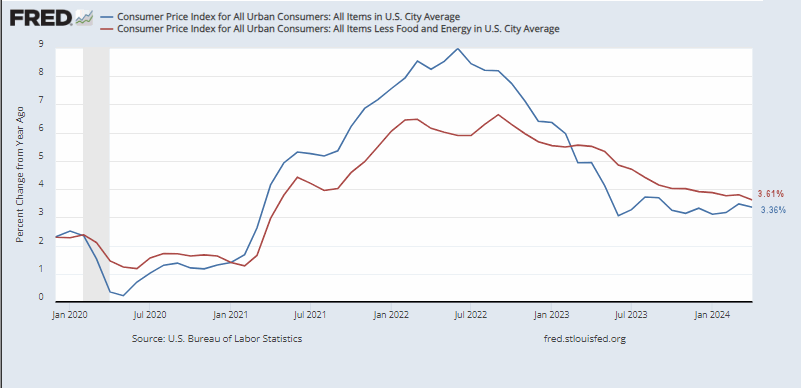
Source: St. Louis FED
M2 Money Supply
Looking at the M2 money supply we get a slightly different picture.
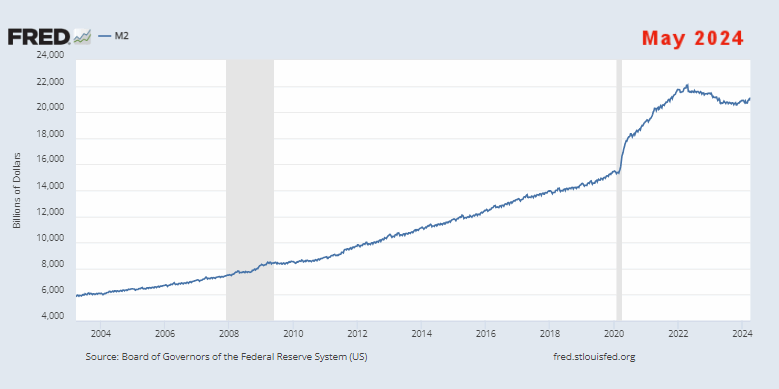
Here we see a steady growth of the money supply from 2009 through 2020 then a sharp spike as we saw with FED assets and then a slightly less sharp incline (but longer duration) taking M2 to 22 Trillion dollars in 2022. From 2022 to 2023 we see the decline we would expect due to the reduction of FED assets… BUT rather than continuing to decline in 2023 as FED assets do, M2 levels out and despite FED assets declining in 2024 M2 actually shows a bit of an uptick. This could be the reason for the rebound in the stock market, beginning at about the same time as this uptick in M2. Not surprisingly, this is just in time to boost the market for the November election.
Typically, the FED tries to keep things as steady as possible during an election year, to avoid the appearance of partiality. But as we noted in the NYSE ROC commentary, the M2 money supply is increasing despite FED assets declining. This could be a stealth move to boost the market (and help Biden) just in time for the election. Rumor has it that FED chairman Jerome Powell doesn’t like Trump… primarily, I believe, because Trump has tried to reign in the FED’s money-printing ability and return to a quasi-gold standard.
Energy Prices
Overall energy prices have been down over the last year because the government was flooding the market with cheap oil by depleting our strategic petroleum reserves. But at some point, they have to replace those reserves (perhaps at much higher prices). Note: Reserves would have started at much higher levels had Democrats not refused Trump’s request to increase reserves when oil was cheap.
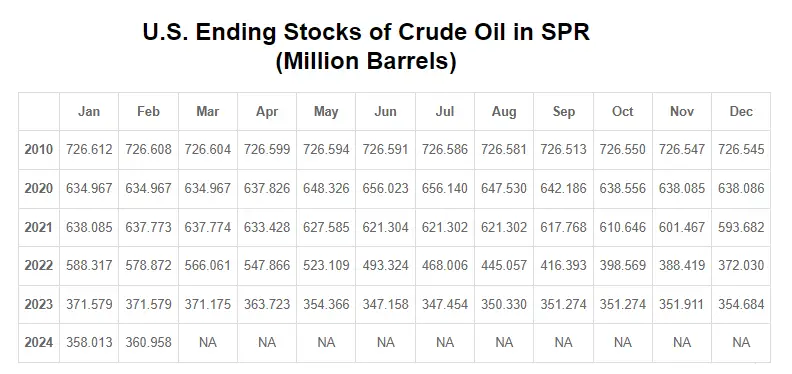
This chart from the U.S. EIA shows the extent of the recent strategic petroleum reserve drawdown compared to those of Desert Storm, various hurricanes, and other supply disruptions. Unfortunately, the E.I.A. is always a couple of months behind in updating its chart. But with the data we have we can see that the recent draw-down dwarfs all of the others combined. In July 2020, the SPR stood at 656,140,000 barrels. It has started to tick up in the last few months.
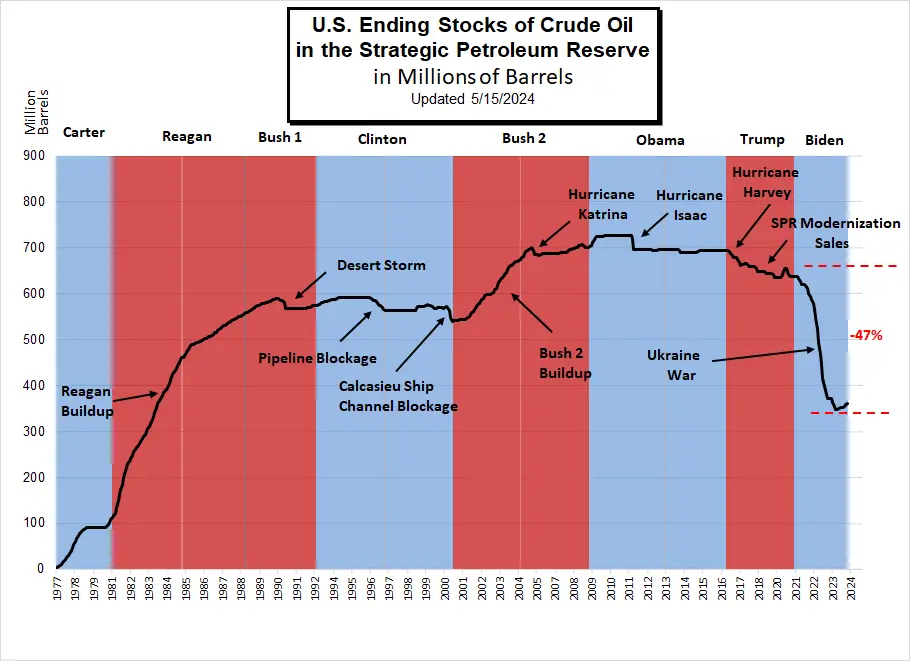 Note: Section 404 of the Bipartisan Budget Act of 2015 authorizes the Secretary of Energy to draw down and sell up to $2 billion of SPR crude oil, for fiscal years (FY) 2017 through 2020, to carry out an SPR modernization program.
EIA Data History of SPR Releases
Inflation Chart
Monthly Inflation Compared to Previous Years:
The monthly inflation rate for April 2024 was 0.39%.
In the chart below, we can see how the monthly inflation compares between 2018 (light green), 2019 (light blue), 2020 (pink), 2021 (purple), 2022 (orange), 2023 (dark), 2024 (teal). Interestingly, January 2018 and January 2024 are identical. From this Chart, we can see, that April 2024’s 0.39% is lower than April 2023’s 0.51%.
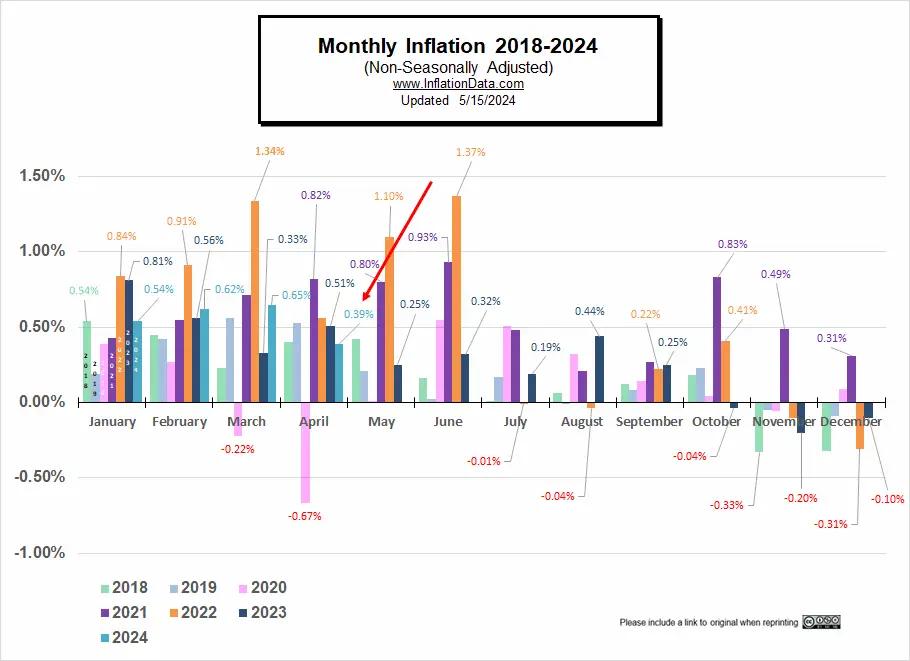
Not Seasonally Adjusted Monthly Inflation Rates
Note: January 2022’s 0.84% was the highest January since 1990. June was the highest June since 1941 (although the first quarter of 1980 had some higher rates). Typically, the first quarter has the highest monthly inflation and the 4th quarter is the lowest (even negative).
| Jan | Feb | Mar | Apr | May | Jun | Jul | Aug | Sep | Oct | Nov | Dec | |
| 2016 | 0.17% | 0.08% | 0.43% | 0.47% | 0.41% | 0.33% | (0.16%) | 0.09% | 0.24% | 0.12% | (0.16%) | 0.03% |
| 2017 | 0.58% | 0.31% | 0.08% | 0.30% | 0.09% | 0.09% | (0.07%) | 0.30% | 0.53% | (0.06%) | 0.002% | (0.06%) |
| 2018 | 0.54% | 0.45% | 0.23% | 0.40% | 0.42% | 0.16% | 0.01% | 0.06% | 0.12% | 0.18% | (0.33%) | (0.32%) |
| 2019 | 0.19% | 0.42% | 0.56% | 0.53% | 0.21% | 0.02% | 0.17% | (0.01%) | 0.08% | 0.23% | (0.05%) | (0.09%) |
| 2020 | 0.39% | 0.27% | (0.22%) | (0.67%) | 0.002% | 0.55% | 0.51% | 0.32% | 0.14% | 0.04% | (0.06%) | 0.09% |
| 2021 | 0.43% | 0.55% | 0.71% | 0.82% | 0.80% | 0.93% | 0.48% | 0.21% | 0.27% | 0.83% | 0.49% | 0.31% |
| 2022 | 0.84% | 0.91% | 1.34% | 0.56% | 1.10% | 1.37% | (0.01%) | (0.04%) | 0.22% | 0.41% | (0.10%) | (0.34%) |
| 2023 | 0.80% | 0.56% | 0.33% | 0.51% | 0.25% | 0.32% | 0.19% | 0.44% | 0.25% | (0.04%) | (0.20%) | (0.10%) |
| 2024 | 0.54% | 0.62% | 0.65% | 0.39% |
See: Monthly Inflation Rate for more information and a complete table of Unadjusted Monthly Rates.
Misery Index
Current Misery Index:
Unemployment 3.9% + Inflation 3.36% = 7.26%
Unemployment was up 0.1% but inflation was down.
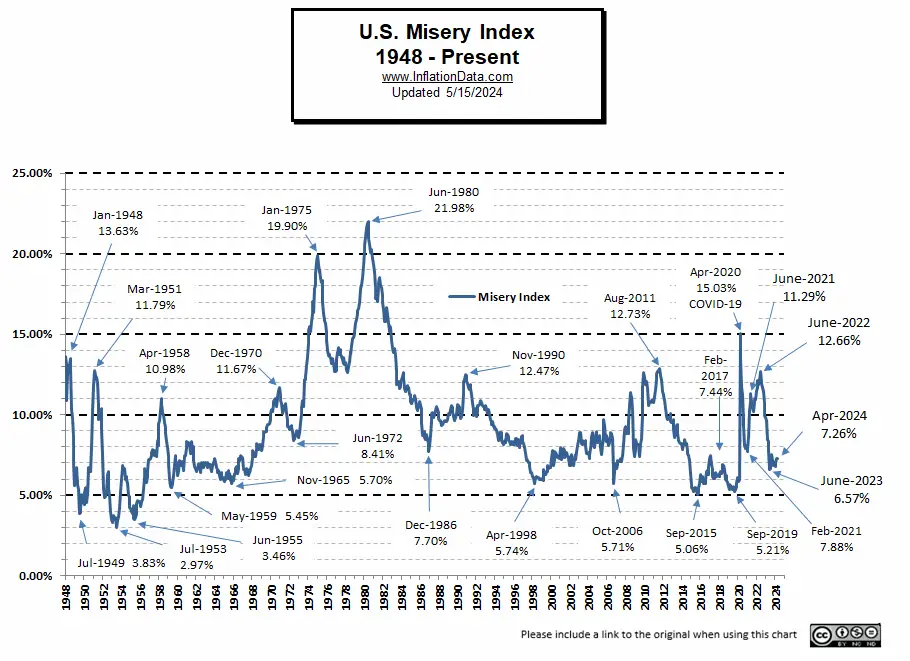
[Read More on the Misery Index…]
Rate of Change (ROC) Charts
We changed the ROC Format this month and added a Crypto ROC chart. The NASDAQ dipped down from last month (issuing a tentative sell signal) while the NYSE continues upward.
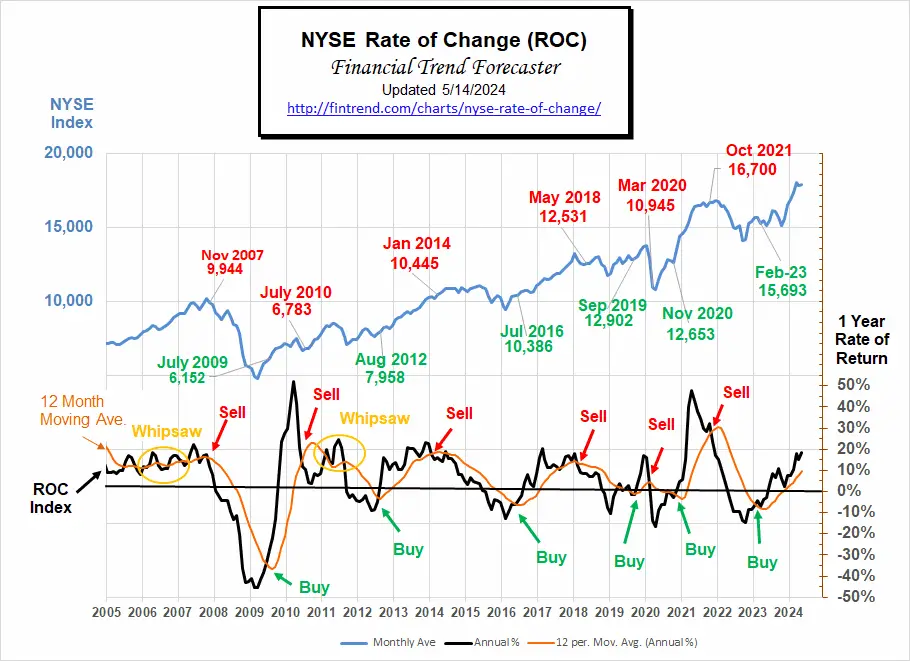
For more information, see NYSE Rate of Change (ROC) and NASDAQ ROC Chart.
You Might Also Like:
From InflationData.com
- 4 Key Factors to Consider When Hedging Against Inflation
- March Inflation Causes Market Concern
- Hyperinflation- How a Trickle Can Turn into a Flood
- Inflation, High Inflation, and Hyperinflation
- Industries Most Affected by Inflation: Insights from the Global Supply Chain
- Have Wages Kept Up with Inflation
- Not All Prices Have Inflated Since 1964
From Financial Trend Forecaster
- Moore Inflation Predictor
- NYSE ROC
- NASDAQ ROC
- 4 Key Factors to Consider When Hedging Against Inflation
- March Inflation Causes Market Concern
- Hyperinflation- How a Trickle Can Turn into a Flood
- Inflation, High Inflation, and Hyperinflation
- Industries Most Affected by Inflation: Insights from the Global Supply Chain
- Have Wages Kept Up with Inflation
- Not All Prices Have Inflated Since 1964
From UnemploymentData.com.
- Unlocking The Value Of A “Career College” Degree In Today’s Economy
- April Unemployment- Bad News is Good News?
- The Challenges and Triumphs of Working in Emergency Care
- 7 Skills You Need When Starting a Roofing Business
- March 2024 Employment Higher Than Expected
From Elliott Wave University
- Why You Should Pay Attention to This Time-Tested Indicator Now
- Gold: Setting Near-Term Price Targets
- Bob Prechter on the Rich Dad Radio Show
- A.I. Revolution and NVDA: Why Tough Going May Be Ahead
- Free report: ‘Gold Investors’ Survival Guide’
From OptioMoney
- How Moving to a New Place Impacts Your Spending Patterns
- The “Ins and Outs” of Energy-Efficient Windows
- How to Effectively Manage Credit Cards as a Homeowner
- What are “Moving Loans” and Do You Need One?
- Navigating Currency Exchange: Maximizing Your Money When Moving Abroad
From Your Family Finances
- Neglect These Essential Home Repairs At Your Peril
- Can You Profit- Buying and Selling Gold as a Hobby?
- “How Relocating To Florida Can Stretch Your Retirement Dollars”
- 5 Ways to Save Money on Your Heating Bill
- Estate Planning in the Digital Age: Protecting Your Online Assets

Leave a Reply