
The U.S. Bureau of Labor Statistics released the Annual Inflation Rate data for the year ending in August on September 14th 2017.
- Annual inflation was 1.94% in August up from 1.73% in July.
- CPI-U 245.519
- Monthly Inflation for August 0.30%
- Next release October 18th
According to the U.S. Bureau of Labor Statistics (BLS) –
“Increases in the indexes for gasoline and shelter accounted for nearly all of the seasonally adjusted increase in the all items index. The energy index rose 2.8 percent in August as the gasoline index increased 6.3 percent. The shelter index rose 0.5 percent in August with the rent index up 0.4 percent. The food index rose slightly in August, with the index for food away from home increasing and the food at home index declining.
The index for all items less food and energy rose 0.2 percent in August.”
Monthly Inflation Spikes
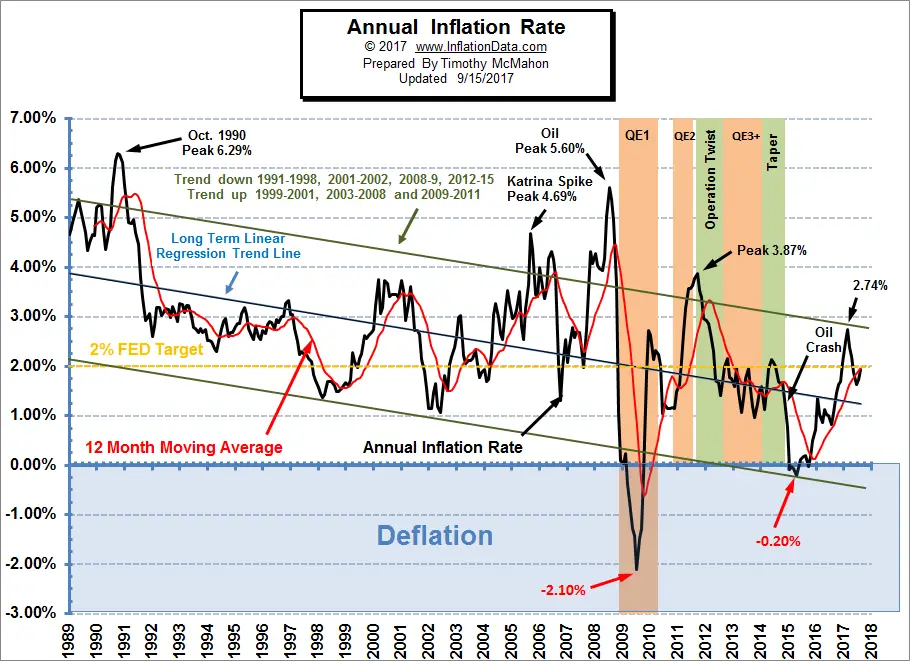
Monthly inflation for August 2017 was 0.30% compared to 0.09% in 2016
Typically the months of June through September are moderately inflationary and October through December produce the lowest increase in prices and are often even deflationary. The majority of inflation usually occurs during the first few months of the year, but this year the high inflation months did not produce as much annual inflation as usual, but August produced much more than average. In 2016 monthly inflation for August was a mere 0.09% while in 2017 it spiked to 0.30% more than 3 times as much. The average monthly inflation for August since 2008 was 0.078% (very close to 2016’s level).
See Annual Inflation Chart for more info.
How the Inflation Cycle Influences the Job Market
 Inflation is generally a gradual process, so most people don’t put much thought into inflation, since it happens so slowly. But certain things can cause inflation to occur at a faster rate than it normally would and at times countries even experience hyperinflation like Zimbabwe did several years ago and Venezuela is now. But even when it is gradual, creeping inflation can have a major effect on just about everyone.
[Read More…]
OECD International Inflation Rates
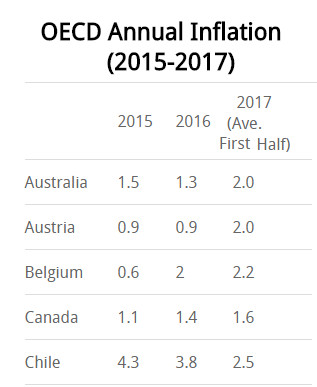 The OECD published the Annual Inflation Rates rates of its member countries plus several other countries as well. Noticeably absent is Argentina, since their official data is still considered unreliable. The highest inflation OECD countries are Turkey, Mexico, Latvia and Estonia and the lowest inflation countries are Japan, Ireland, Switzerland and Israel. [Read More…]
Could the Next Oil Price Spike Cripple The Industry?
In the following article Andreas de Vries and Dr. Salman Ghouri of Oilprice.com discuss the possibility of oil price spikes crippling the oil industry. At first blush that seems highly unlikely. … [Read More…]
Misery Index
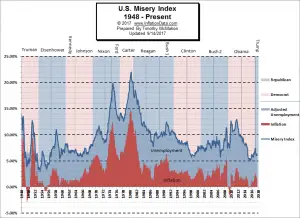 The misery index as of September 2017 (based on the most recent official government data for the 12 months ending in August) is at 6.34% (4.4% unemployment and 1.94% inflation) up from the last two months (at 6.03%). [Read More…]
New Battery UnVeiled
The Lithium Ion battery (Li-Ion) was invented by Adam Heller over 40 years ago and it still reigns supreme as the best hope for lightweight batteries. It runs everything from laptops to Teslas to … [Read More…]
Moore Inflation Predictor
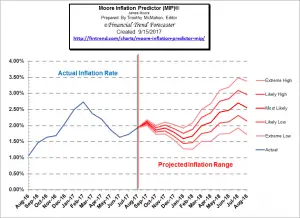 Back in June we said that ” This month, the MIP is projecting an upturn for a couple of months and then we may see another slight downturn”. Last month the MIP projected a max high of 1.99% for August and a midrange high of 1.94% and so we hit the mid-range high on the nose.
See Moore Inflation Forecast for more info.
NYSE Rate of Change (ROC)©
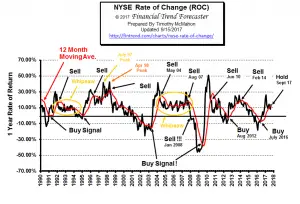 The NYSE Rate of Change (ROC) chart is helpful in getting the “big picture” of the stock market very quickly. The old saying “a picture is worth a thousand words” is very applicable to this chart. Once you understand how to read the ROC chart you can easily spot the direction of the market which makes it easy for you to know whether you want to be invested in the market or not.
See what the NYSE Rate of Change is saying now.
NASDAQ Rate of Change (ROC)©
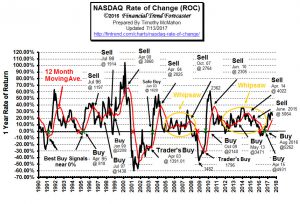
Annual returns are still above 20% in the NASDAQ and unlike the NYSE which generated a sell signal and then promptly moved back above moving average the NASDAQ never fell below the line. … See NASDAQ ROC for more.
You Might Also Like:
- What Can We Learn About the Stock Market From the NY Subway?
- Bitcoin: The New Safe Haven?
- Investing: The Incredible Power Of Staying In The Now
- Skeptical Bias Toward Stocks Aligns With Bullish Charts
- What Does “Paddle-boarding” Have to do with Speculating?
- Understanding the Relative Strength Index (RSI)
- Top 3 Technical Tools Part 1: Japanese Candlesticks
- 7 Tips for Keeping Your Bank Account Absolutely Secure
- Today’s Most In-Demand Medical Jobs
- August Unemployment Numbers
- 4 Ways Small Businesses Are Changing Ancient POS Trends
- How to Stop Burnout and Build Momentum in Your Career
- Worldwide Unemployment Rates
- Investments to Consider for Retirement
- 5 Ways to Finally Break Free of Student Loans
- Better Way: Money-Wasting Mistakes To Avoid When Moving
- Homemade, Natural, Affordable Cleaning Solutions
- How Much House Can You Afford?

Leave a Reply