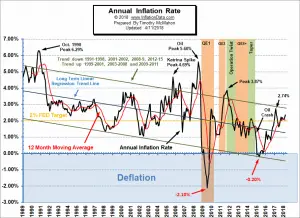
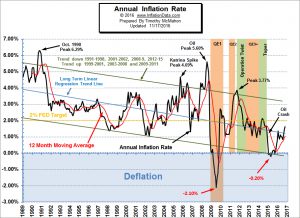
The U.S. Bureau of Labor Statistics released the Annual Inflation Rate data for the year through the end of March on April 11th 2018. Annual Inflation is Up Annual inflation rate was 2.36% up from 2.21% in February. CPI was 249.554 in March, 248.991 in February, 247.867 in January and 246.524 in December. Monthly Inflation for March 2018= 0.23% Monthly Inflation for March 2017= 0.08% Next release May 10th Monthly Inflation: Typically the monthly inflation rate is highest during the first quarter (January through March) and lowest during the last quarter (October through December). March 2018 had 0.23% monthly inflation which was below February's 0.45% but it … [Read more...]
Monthly Inflation Spikes in August
The U.S. Bureau of Labor Statistics released the Annual Inflation Rate data for the year ending in August on September 14th 2017. Annual inflation was 1.94% in August up from 1.73% in July. CPI-U 245.519 Monthly Inflation for August 0.30% Next release October 18th According to the U.S. Bureau of Labor Statistics (BLS) - "Increases in the indexes for gasoline and shelter accounted for nearly all of the seasonally adjusted increase in the all items index. The energy index rose 2.8 percent in August as the gasoline index increased 6.3 percent. The shelter index rose 0.5 percent in August with the rent index up 0.4 percent. The food index rose slightly in August, with the … [Read more...]
July CPI Down But Inflation Up
The Bureau of Labor Statistics Released the Inflation Data for the Year ending in July on August 11th. Annual inflation was 1.73% in July - Up from 1.63% in June, but down from 1.87% in May, 2.20% in April, 2.38% in March, 2.74% in February, and 2.50% in January. CPI 244.786 in July down from CPI 244.955 in June Monthly Inflation for July -0.07%, June 0.09%, May 0.09%, April was 0.30%, March was 0.08%, February was 0.31% and 0.58% in January. Next release September 14th The reason the CPI went down but inflation went up is because July 2016 monthly inflation was -0.16% and this July was less negative. So CPI goes down for the month but not as much as last year so Annual … [Read more...]
Inflation 1.63% in June
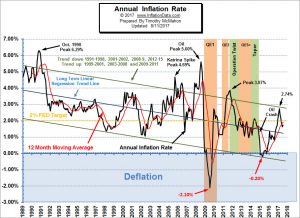
The U.S. Bureau of Labor Statistics released the Annual Inflation Rate data for the year ending in June on July 14th 2017. Annual inflation was 1.63% in June - down from 1.87% in May, 2.20% in April, 2.38% in March, 2.74% in February, and 2.50% in January. June CPI-U 244.955-- May CPI-U 244.733 Monthly Inflation for June 0.09%, May 0.09%, April was 0.30%, March was 0.08%, February was 0.31% and 0.58% in January. Next release August 11th Annual Inflation Chart Annual inflation for the 12 months ending in June 2017 was 1.63% down from 1.87% in May, 2.20% in April, 2.38% in March, 2.74% in February and 2.50% in January. The annual cyclical low was 0.84% in July 2016. The … [Read more...]
Inflation Climbs Again in October
The U.S. Bureau of Labor Statistics (BLS) released the monthly and annual inflation rate data for October 2016 on November 17th. The current annual inflation rate is 1.64% up from 1.46% in September. Monthly inflation was 0.12% for the month of October 2016, while October 2015 was -0.14%. meaning that as the negative number fell out of the calculation and was replaced by a positive one, annual inflation jumped up. Historically, the 4th quarter, i.e. October, November and December have been negative inflation months i.e. disinflationary. So having positive inflation for the month of October is a bit unusual and could indicate a trend toward rising inflation or it could simply be the … [Read more...]
CPI Reaches All-Time High
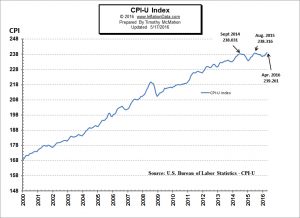
BLS Releases April Inflation Data The U.S. Bureau of Labor Statistics (BLS) released the inflation data for the year ending in April on May 17th, 2016. The Annual Inflation Rate was 1.13% up from 0.85% last month. The Consumer Price Index (CPI-U) reached an all-time high of 239.261. Normally, this wouldn't be news since for years it made a new high almost every month. But after peaking at 238.316 last August (2015) the index fell to 236.525 by December and took 8 months (until April) to climb above August's level. Interestingly, in September 2014 the index was 238.031. So it has taken 19 months for overall prices to exceed the level first attained in September 2014. This doesn't … [Read more...]
Inflation Picks Up in December
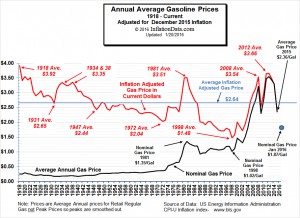
The U.S. Bureau of Labor Statistics (BLS) published their current inflation (CPI-U) report for the month of December on January 20th. The Consumer Price Index was 236.525 down from 237.336 in November. With the index going down you would think that we would have deflation but because when we say inflation or deflation we are talking about annual inflation/deflation we need to compare the index to the index from a year previous. Since the CPI-U for December 2014 was 234.812 and the current index is higher, we had annual inflation of 0.73%. According to the BLS, over the last 12 months Energy Prices have fallen -12.6%. Specifically, Gasoline is down -19.7%, Fuel Oil is down -31.4% and … [Read more...]
Inflation UP, CPI Down for November
The Bureau of Labor Statistics (BLS) released their inflation numbers for the year ending November 30th on December 15, 2015. The Consumer Price Index (CPI-U) for November was 237.336 down from 237.838 at the end of October so overall prices declined -0.21% over the month but Annual Inflation was still up 0.50% (or ½%) for the year. This is the 4th month in a row where prices are lower than the previous month. In the table below we can see that last November the CPI was at 236.151. Then prices fell through January peaked in July and then fell to current levels. Month CPI-U Index Monthly Inflation Annual … [Read more...]
Deflation Returns in September
The Bureau of Labor Statistics (BLS) released their inflation numbers for the year ending September 30th on October 15, 2015. Monthly inflation was negative (disinflationary) for the second month in a row resulting in annual deflation of -0.04%. Although at this level the deflation is so slight that the BLS rounds it to Zero. So basically prices are on par with those of a year ago. However, that doesn't mean that all prices are identical to those of a year ago. In the report issued by the BLS yesterday we note that food prices are up 1.4% over a year ago while energy prices are down -18.4%. and all other items excluding food and energy are up 1.9% so we see that the primary cause of the … [Read more...]
CPI Index Down but Annual Inflation Flat
The Bureau of Labor Statistics (BLS) released their monthly Consumer Price Index (CPI-U) and Inflation report for the year ending in August on September 16th. The CPI index fell slightly from 238.654 in July to 238.316 in August resulting in monthly deflation but Annual Inflation for the year ending in August was 0.20% up from 0.17% for the year ending in July. That means that something that cost $100 a year ago would cost $100.20 today. That is compared to the typical inflation of around 3% which would mean that something that cost $100 last year would cost $103 this year. The CPI-U index a year ago was 237.852 and is currently 238.316. On an Annual basis Energy fell 15.0% over the … [Read more...]

