
BLS Releases April Inflation Data
The U.S. Bureau of Labor Statistics (BLS) released the inflation data for the year ending in April on May 17th, 2016. The Annual Inflation Rate was 1.13% up from 0.85% last month.
The Consumer Price Index (CPI-U) reached an all-time high of 239.261. Normally, this wouldn’t be news since for years it made a new high almost every month. But after peaking at 238.316 last August (2015) the index fell to 236.525 by December and took 8 months (until April) to climb above August’s level. Interestingly, in September 2014 the index was 238.031. So it has taken 19 months for overall prices to exceed the level first attained in September 2014.
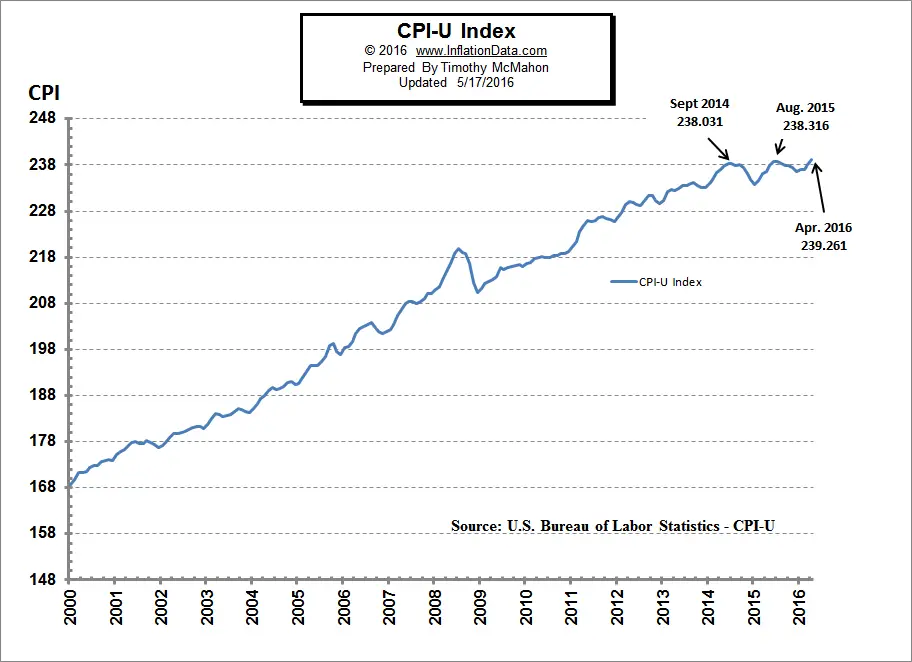
This doesn’t mean that all prices are the same as they were 19 months ago, the primary factor during this period was lower gas prices. So while things like healthcare and education continued their inexorable march higher falling gas prices brought the overall total down.
April Inflation Report
Annual Inflation rose from 0.85% for the 12 months ending in March to 1.13% for the 12 months ending in April. Prices rose 0.47% for the month of April and 0.43% in March, so monthly inflation in March and April accounted for the majority of the total inflation for the entire year. However, they were not the only high months May of 2015 was 0.51% and June 2015 was 0.35% but since the months from August through December were negative (disinflationary) they erased much of the inflation.
Current Annual Inflation Chart
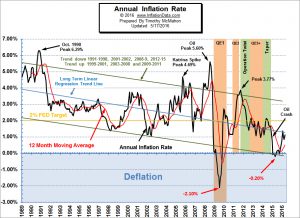 We’ve updated the current annual inflation chart which shows the Current Annual Inflation Rate starting in 1989. Over the last twenty-two months since the 2014 peak in the CPI index, we have had eleven months of monthly deflation (annual disinflation) i.e. where prices were slightly lower than they were the previous month.
Misery Index
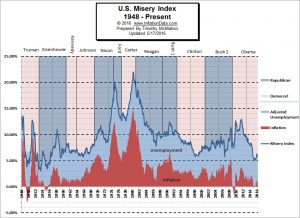 Both high unemployment and high inflation have a major impact of the average family, so the misery index is an easy way to measure the health of the economy. As unemployment and the cost of living increase more people cross the economic line into poverty.
The original Misery index was created by economist Arthur Okun during the Johnson administration in the 1960’s, unfortunately, data for the misery index is only available back to 1948 due to the lack of unemployment numbers prior to 1948. Read more …
Moore Inflation Predictor
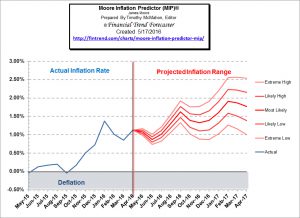 The Moore Inflation Predictor© (MIP) is a highly accurate graphical representation designed to forecast the inflation rate. By watching the turning points, we can profit from inflation hedges (like Gold, Real Estate and Energy Producers) when the inflation rate is trending up and from Bonds when the inflation rate is trending down. Last month’s MIP projected an up-move in inflation with extreme high in the neighborhood of 1.1%. We said, “the MIP is projecting a slight uptick in annual inflation which could take us above 1% again.” Monthly inflation was 0.47% for April replacing a 0.20% for April 2015. See what the MIP is projecting now …
NYSE Rate of Change (ROC)
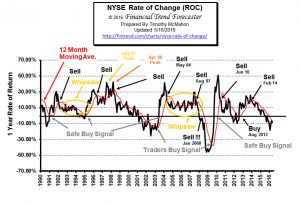 The NYSE took a series of tumbles from August 2015 through the February 11th bottom at 9029.88. But from that bottom we have seen a bit of a rebound which the media is taking as the sign of a new bull market. However, at this point although the NYSE index is above its 200 day moving average the ROC has not crossed above its moving average yet and the index is actually 27 points below where it was a month ago.
See NYSE-ROC for more information.
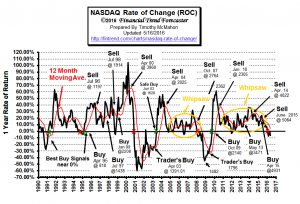 NASDAQ Rate of Change (ROC)
The NASDAQ index generated a “tentative buy signal” for more aggressive traders last month by crossing above the zero line but lost it again this month by falling below once again. Last month we said, “More conservative investors would want to wait for confirmation of the ROC crossing above its moving average.”
See NASDAQ ROC for more information.

Leave a Reply