
The Bureau of Labor Statistics (BLS) released their inflation numbers for the year ending November 30th on December 15, 2015. The Consumer Price Index (CPI-U) for November was 237.336 down from 237.838 at the end of October so overall prices declined -0.21% over the month but Annual Inflation was still up 0.50% (or ½%) for the year. This is the 4th month in a row where prices are lower than the previous month.
In the table below we can see that last November the CPI was at 236.151. Then prices fell through January peaked in July and then fell to current levels.
| Month | CPI-U Index | Monthly Inflation | Annual Inflation |
| Nov-14 | 236.151 | -0.54% | 1.32% |
| Dec-14 | 234.812 | -0.57% | 0.76% |
| Jan-15 | 233.707 | -0.47% | -0.09% |
| Feb-15 | 234.722 | 0.43% | -0.03% |
| Mar-15 | 236.119 | 0.60% | -0.07% |
| Apr-15 | 236.599 | 0.20% | -0.20% |
| May-15 | 237.805 | 0.51% | -0.04% |
| Jun-15 | 238.638 | 0.35% | 0.12% |
| Jul-15 | 238.654 | 0.01% | 0.17% |
| Aug-15 | 238.316 | -0.14% | 0.20% |
| Sep-15 | 237.945 | -0.16% | -0.04% |
| Oct-15 | 237.838 | -0.04% | 0.17% |
| Nov-15 | 237.336 | -0.21% | 0.50% |
Annual Inflation
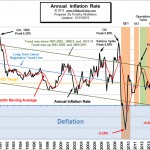 The Current Annual Inflation Rate chart plots the annual inflation rate since 1989. Annual inflation for the 12 months ending in November 2015 was up slightly at 0.50% from 0.17% in October. At only 1/2% this is still significantly lower than the official FED target of 2% but inflation has moved up through its 12 month moving average so this could mean that short-term the trend is now up.
Of course since inflation is at the bottom of the channel it could still move all the way to the top of the channel and the long term trend could remain down. However, based on timing alone the long term trend has been down since it peaked in 1980. That is just over 35 years. So it is quite possible that the low of -2.10% in July of 2009 was the low and from here it will create a new channel cyclically moving higher for the next 35 years.
Inflation Projections
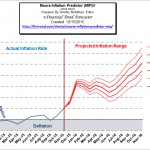 Last month’s MIP was projecting a mid-range high of 0.44% and a worst case high of 0.51%, November’s annual inflation rate was 0.50%, so we just squeaked by. Monthly inflation for December 2014 and January 2015 are also very negative so if they are replaced by less negative numbers that will also account for the massive jump in annual inflation showing on this projection.
Generally, the first quarter of the year is highly inflationary with the last quarter being deflationary but 2015 was an exception with January having -0.54% monthly deflation. So if January 2016 is back to “normal” with roughly 0.50% INFLATION we could see the annual inflation rate jump a full percentage point in one month, which could easily panic the uninitiated.
NYSE Rate of Change (ROC)
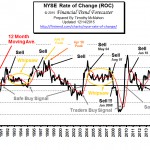 The NYSE has taken three tumbles since August. On August 17th the NYSE closed at 10,818 and by August 25th it had fallen to 9,692 for a loss of 10.4% in just over a week. Then it rebounded bouncing between 10,000 and 10,250 before falling to a lower low at 9601 on September 28th. By November 3rd it had rebounded to 10609.92 but just 10 days later it had fallen to 10,155.07 for a 4.2% loss. Currently it is down even further at 9,986 but still not back to the September low.
In October we said that, “it isn’t out of the woods yet. There is considerable resistance between 10,500 and 10,750.”
Back in February 2014, the ROC generated a sell signal to get out at around 10,254 so you could have been safely invested in some sort of fixed income investments over that period and not missed any gains. See: NYSE ROC Chart for more info.
NASDAQ ROC
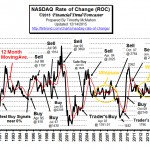 The NASDAQ index fell 0.65% over the previous month but the annual rate of return was 6.61% last month and 6.63% this month. This is still a respectable rate of return and considerably better than the NYSE which is currently looking at a year-over-year LOSS of -6.99%. But because the NASDAQ rate of return continues to be below its moving average the NASDAQ ROC continues its SELL signal!
See : NASDAQ Rate of Change for more information.
Misery Index
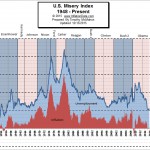 The misery index is an economic indicator designed to help determine how the average citizen is doing economically and it is calculated by simply adding the inflation rate to the unemployment rate.
The misery index as of December 2015 (based on the most recent official government data for the year ending in November 2015) is at 5.50% (5.0% unemployment and 0.50% inflation) down from a peak of 12.87% in both October and November 2011 which was pretty miserable. With inflation at historically low levels the major component of the Misery index is unemployment. The average inflation rate since the beginning of the Misery Index in January 1948 is 3.59% which is 3.09% higher than current inflation levels so if inflation were “average” the misery index would be much higher. More…
Crude Oil vs. Gasoline
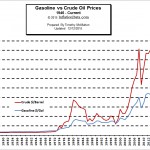 With the steady decline in gasoline prices during 2015 people aren’t too concerned with the price of gas anymore. But on occasion crude oil prices have fallen without the corresponding decline in gasoline prices.
When this occurs someone always asks me if the prices are actually correlated or are the oil companies just ripping us off. This prompted me to create a chart comparing the price of crude oil to that of gasoline so you can see for yourself how well they correlate and I recently updated that chart.
See the full article here: Gasoline vs. Crude Oil Prices.
You might also enjoy:
- Are Low Crude Oil Prices a “Boom Or A Curse” For The World Economy?
Includes: Top 10 Crude Oil Producing Countries, Oil prices needed for various oil producing countries to balance their budgets, marginal production costs for various countries, the severity of the recent crude oil price fall, the effects of falling oil prices on Russia, the effects of falling oil prices on OPEC, the correlation of crude oil prices and Saudi Arabian oil production and much more. - Strippers Suffering From Low Oil Prices– With OPEC breaking down and any kind of coordination among its members on price cuts looking increasingly unlikely, it now appears that oil prices could remain below $50 a barrel for a year or more. As producers confront this unpleasant reality, some will finally start to significantly curtail or even shut down operations. And that is going to severely hurt an all but invisible group; strippers in the United States.
- Inflation Adjusted Commodity Prices– What is the inflation adjusted price of common commodities?

Leave a Reply