
The U.S. Bureau of Labor Statistics (BLS) published their current inflation (CPI-U) report for the month of December on January 20th. The Consumer Price Index was 236.525 down from 237.336 in November. With the index going down you would think that we would have deflation but because when we say inflation or deflation we are talking about annual inflation/deflation we need to compare the index to the index from a year previous. Since the CPI-U for December 2014 was 234.812 and the current index is higher, we had annual inflation of 0.73%.
According to the BLS, over the last 12 months Energy Prices have fallen -12.6%. Specifically, Gasoline is down -19.7%, Fuel Oil is down -31.4% and Electricity is down -1.2%. On the other hand motor vehicle insurance is up 5.7%, Hospital services are up 4.2%, and rent is up 3.7%.
Gasoline… How Low Can You Go?
 It almost sounds like gasoline is playing the “Limbo” game.
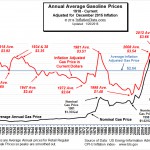
This month we have updated our inflation adjusted gasoline price chart. In it we can see that when we adjust historical gasoline prices for inflation, the current price of gasoline is actually nearing an all-time low.
When priced in December 2015 dollars the annual average price of gas was $1.48 in 1998 and currently some places in the U.S. are paying exactly that. However, the nationwide average is still $1.87 and even if prices currently averaged $1.48 nationwide, it would have to continue at that level for a full 12 months to beat 1998’s low but anything is possible…
See: Inflation Adjusted Gasoline Prices for the Full Story.
Annual Inflation
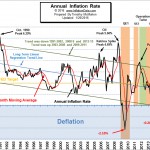 Our Current Annual Inflation Rate chart shows that although it is still low inflation has moved up through its 12 month moving average so this could mean that short-term the trend is now up. Annual inflation for the 12 months ending in December 2015 was up slightly at 0.73% from 0.50% in November.
The CPI index peaked in August and then fell steadily from September 2015 through December 2015 from 237.945 to 236.525 but annual inflation rose. That is because October, November and December 2014 were more deflationary than October, November and December 2015 so as each month’s rate was replaced the ANNUAL inflation rate rose even though the monthly inflation rate was negative (but less negative than the previous year).
Inflation Projections
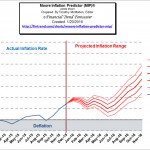 Last month’s MIP was projecting a worst case low of 0.72% and a mid-range low of 0.76%, so once again we just squeaked by. Like the previous two months the current CPI Index was below the previous month’s CPI resulting in monthly deflation (lower prices than a month ago), but the annual inflation rate went up because the current month was less deflationary than the month a year ago. Monthly inflation for January 2015 is also very negative so if they are replaced by less negative numbers that will result in a massive jump in annual inflation. Generally, the first quarter of the year is highly inflationary with the last quarter being deflationary but 2015 was an exception with January having -0.54% monthly deflation. See Moore Inflation Predictor for more information.
NYSE Rate of Change (ROC)
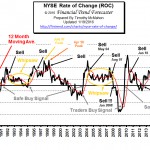 Way back in February 2014, the ROC generated a sell signal to get out at around 10,254 so you could have been safely invested in some sort of fixed income investments for almost two years now and not missed any gains.
If you had earned 2% per year over the last 23 months your investments would currently be the equivalent of NYSE 10,647. Interestingly, the peak way back in 2007 was at 10,311. So we are just back to where the market was eight and a half years ago. Looked at that way this hasn’t been that great of a bull market. And if we adjust for inflation… the market is still underwater. See: NYSE ROC Chart for more info.
NASDAQ ROC
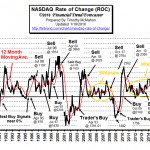 The NASDAQ Rate of Change (ROC) chart shows the annual rate of return of the NASDAQ market along the left axis and the years since 1990 along the bottom. Just like our NYSE Rate of Change chart it shows the rate of return not the current price. The nice thing is that it makes it so much easier to see performance. It is just a matter of whether the index is above or below the zero line… the NASDAQ is up, if we are above the zero line… and the NASDAQ is down if we are below.
The NASDAQ index fell -9.6% over the previous month resulting in an annual rate of return of -2.05%. This is still considerably better than the NYSE which is currently looking at a year-over-year LOSS of -11.54%. And over -17% down from the peak. The NASDAQ rate of return continues to be below its moving average and the NASDAQ ROC continues its SELL signal!
Misery Index
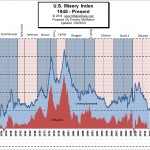 The misery index is calculated by simply adding the unemployment rate to the inflation rate. It is an economic indicator designed to help the average citizen determine how he is doing economically. The misery index as of January 2016 (based on the most recent official government data for the year ending in December 2015) is at 5.73% (5.0% unemployment and 0.73% inflation) down from a peak of 12.87% in both October and November 2011 which was pretty miserable. More…
You might also enjoy:
-
Betting on Deflation May Be a Huge Mistake. Here’s Why…
Although this site is called Inflation Data for the last several years we have been talking a lot about the big “D”… deflation. -
58 Facts About The U.S. Economy From 2015 That Are Almost Too Crazy To Believe
There are a variety of ways to look at things and putting the pieces together is almost like looking through a kaleidoscope as we try to piece the… - Are Low Crude Oil Prices a “Boom Or A Curse” For The World Economy?
As the chart to the left shows, in the period from 2002 until 2014 the U.S. moved from 3rd place to 1st place in world crude oil production. This is primarily due to the improvement in “fracking” …
- Strippers Suffering From Low Oil Prices
With Prices Below $50, what is a stripper to do? With OPEC breaking down and any kind of coordination among its members on price cuts looking increasingly unlikely, it now appears that oil prices …
- Budgeting for Wants Not Just Needs
- Tips for Improving Your Retirement
- 5 Things You Are Probably Paying Too Much For… And What You Can Do
- 6 Things to Discuss With Your Financial Adviser before Tax Season

Leave a Reply