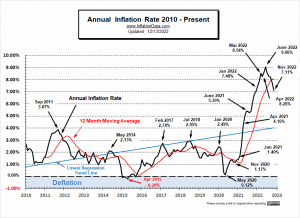
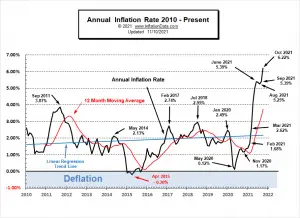
The Bureau of Labor Statistics reported that Annual Inflation fell from 7.75% in October to 7.11% in November 2022. This was down from a peak of 9.06% in June 2022. Monthly inflation was negative (Disinflation) for November at -0.10%. This is fairly typical for the fourth quarter, which is traditionally negative. Monthly inflation for 2022 was lower than in November 2021 so Annual inflation fell. It is important to remember that although the inflation RATE is falling... prices are still going up, i.e., prices are still 7% higher than they were a year ago. A decline from 7.75% to 7.11% is similar to a car going from 77 mph to 71 mph... it is still speeding forward just not quite as … [Read more...]
Annual Inflation Retreats in October
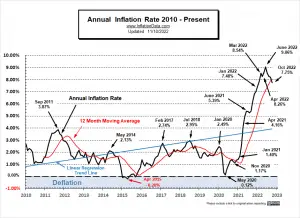
The Bureau of Labor Statistics reported that Annual Inflation for October 2022, fell from 8.20% to 7.75% Monthly inflation at 0.41% was still very high for a month in the fourth quarter, which is traditionally negative or at least very close to zero. But although high, October 2022 monthly inflation was still lower than in October 2021. So… Annual inflation for the 12 months ending in October 2022 fell to 7.75%. This was down from 8.20% in September 2022. Inflation Summary: Annual Inflation fell from 8.20% to 7.75% CPI Index rose from 296.808 to 298.012 Monthly Inflation for October was 0.41% Next release is December 13th October Annual Inflation was 7.75%. Jan. … [Read more...]
April Inflation Down, But…
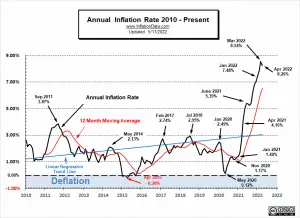
The Bureau of Labor Statistics reported that in April 2022, Inflation fell to 8.3% Inflation Summary: Annual Inflation Declined from 8.54% in March to 8.26% in April CPI Index rose from 287.504 to 289.109 Monthly Inflation for April was 0.56%, down from 1.34% in March The next release is on June 10th April 2022 Annual Inflation was 8.26%. Jan. 2021 -- 1.40% ** Jan. 2022 -- 7.48% ** Feb. 2022 -- 7.87% ** March 8.54% Gasoline prices were artificially lower due to a massive release from the Strategic Petroleum Reserves (SPR), which temporarily pushed inflation down in April. The International Energy Agency was not happy that the Biden administration didn't warn them that it … [Read more...]
Does the CPI Exclude Mortgages or Rent?
I recently got the question, Why does the CPI exclude rent? So I'm answering that here. The Consumer Price index doesn’t exclude rent. It actually has an entire section entitled “Shelter”. But not everyone rents... some people actually own their own homes. So to cover everyone they created a sort of hybrid rent/ownership component to the CPI called “owner’s equivalent rent”. According to the Bureau of Labor Statistics who calculate the CPI, “The expenditure weight in the CPI market basket for Owners’ Equivalent Rent of primary residence (OER) is based on the following question that the Consumer Expenditure Survey asks of consumers who own their primary residence: “If someone were to … [Read more...]
Millennials Have Never Seen Inflation This High
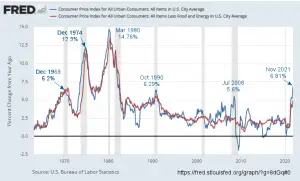
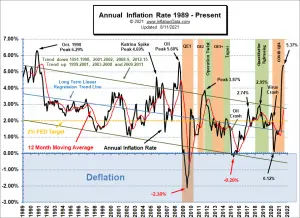
The Bureau of Labor Statistics reported that the Annual Inflation Rate rose again in November. Inflation Summary: Annual Inflation highest since May 1982. CPI Index rose from 276.589 to 277.948. Monthly Inflation for November was 0.49% Next release January 12, 2022 Inflation for the 12 months ending in November was Up again from October. October 6.22% -- November 6.81% The earliest millennials were born somewhere between 1980-1985 (depending on which definition of millennial you use), just as we were coming off one of the highest Inflation spikes the U.S. has seen since they began tracking the CPI in 1913. In March of 1980, Inflation topped at 14.76%. By May of 1982, … [Read more...]
Annual Inflation Soars to Highest Level in 31 Years
The Annual Inflation Rate exploded in October, according to the Bureau of Labor Statistics report. Inflation Summary: Annual Inflation highest since October 1990. CPI Index rose from 274.310 to 276.589. Monthly Inflation for October was 0.83% Next release December 10th Inflation for the 12 months ending in October was Up Sharply from September. September 5.39% October 6.22% Current levels have exploded through the pink resistance line. Exceeding the 5.60% Oil Peak of July 2008, and coming very close to the October 1990 peak at 6.29%. If next month takes it up even slightly we will have to go all the way back to 1982 to see higher inflation. BLS … [Read more...]
BLS says July Inflation Holds Steady at 5.4%
The U.S. Bureau of Labor Statistics released their Consumer Price Index News Release for the month of July on August 11th, 2021. Inflation Summary: Annual Inflation 5.37% virtually identical to June's 5.39% CPI Index rose from 271.696 in June to 273.003 in July. Monthly Inflation for June was 0.93% and July was 0.48%. Next release September 14th Inflation for the 12 months ending in July was 5.37% identical to August 2008, July 2008 was the previous Peak at 5.60% Last month's 5.39% was the largest increase since August 2008's 5.37%. (Since the BLS rounds to 1 decimal place they reported last month, this month, and August 2008 as 5.4%). If inflation tops the 5.6% of July … [Read more...]
May’s Annual Inflation Soars to ~5%
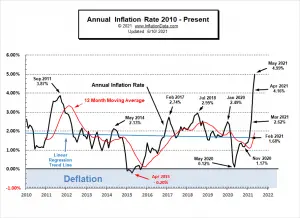
Inflation Summary: Annual Inflation up sharply to ~5% (actually 4.99%) CPI Index rose from 267.054 in April to 269.195 in May. Monthly Inflation for April was 0.82% and 0.80% in May. We have to go back to the Oil Peak of 2008 to see higher inflation. Next release July 13th Annual inflation for the 12 months ending in May was 4.99% Since February, we have been predicting Annual Inflation would shoot up in March and April due to negative numbers falling out of the annual calculation. Although May 2020 was not negative it was virtually zero so replacing it with a massive 0.80% monthly inflation caused the Annual inflation rate to soar once more. Since the BLS rounds … [Read more...]
The 3 Stages of Inflation
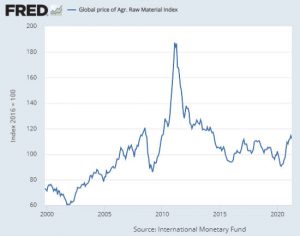
Inflation tends to arrive in 3 stages: Stage 1 The first stage is the price manufacturers pay for their raw materials. This can be tracked in a variety of ways including the Global Price of Agrigated Raw Materials published by the St. Louis Federal Reserve. Interestingly, raw materials prices peaked in February 2011 at 187.2 and then fell steadily over the next 4 years. Prices stabilized for a few years before plummeting due to COVID. Since then raw materials prices have spiked sharply. But are still nowhere near 2011 levels. One of the reasons for the sharp spike in 2011 was serious flooding causing massive crop loss driving the price of four basic crops (wheat, rice, corn, and soybeans) … [Read more...]
February Inflation Increases 20% over January
Inflation Summary: Annual Inflation up from 1.40% in January to 1.68% in February. CPI Index rose from 261.582 in January to 263.014 in February. Monthly Inflation for January was 0.43% and February was 0.55%. Next release April 13th Annual inflation for the 12 months ending in February was 1.68%, a 20% increase over January's 1.40% The CPI index itself was up from 261.582 in January to 263.014 in February. Resulting in a monthly inflation rate of 0.55% which replaced February 2020's 0.27%. Annual inflation for the 12 months ending in February was 1.68%, since the BLS rounds their numbers they report it as 1.7%. Setting the Stage for Inflation Due to the Corona … [Read more...]

