
Inflation Summary:
- Annual Inflation up from 1.40% in January to 1.68% in February.
- CPI Index rose from 261.582 in January to 263.014 in February.
- Monthly Inflation for January was 0.43% and February was 0.55%.
- Next release April 13th
Annual inflation for the 12 months ending in February was 1.68%, a 20% increase over January’s 1.40%
The CPI index itself was up from 261.582 in January to 263.014 in February. Resulting in a monthly inflation rate of 0.55% which replaced February 2020’s 0.27%.
Annual inflation for the 12 months ending in February was 1.68%, since the BLS rounds their numbers they report it as 1.7%.
Setting the Stage for Inflation
Due to the Corona Virus, March and April 2020 were -0.22% and -0.67% respectively, resulting in a massive disinflationary environment. When these numbers fall out of the Annual inflation equation in 2021 we can expect a massive jump in the annual inflation rate. If for instance March 2021 comes in at only 0.28% that would take the annual inflation rate up to 2.18%. If however, March is a more normal 0.50%, we could see March’s Annual inflation at 2.4% (a 40% increase over February) and recent high gas prices could drive it much higher. April 2021, could easily see inflation jump to 3.4% (almost double the current inflation rate). Even in the unlikely event that we see Zero monthly inflation in March and April 2021, the Annual inflation rate will still jump up 0.89% (almost 1%) since those negative numbers will no longer be pulling the average down.
BLS Commissioner’s Inflation Report:
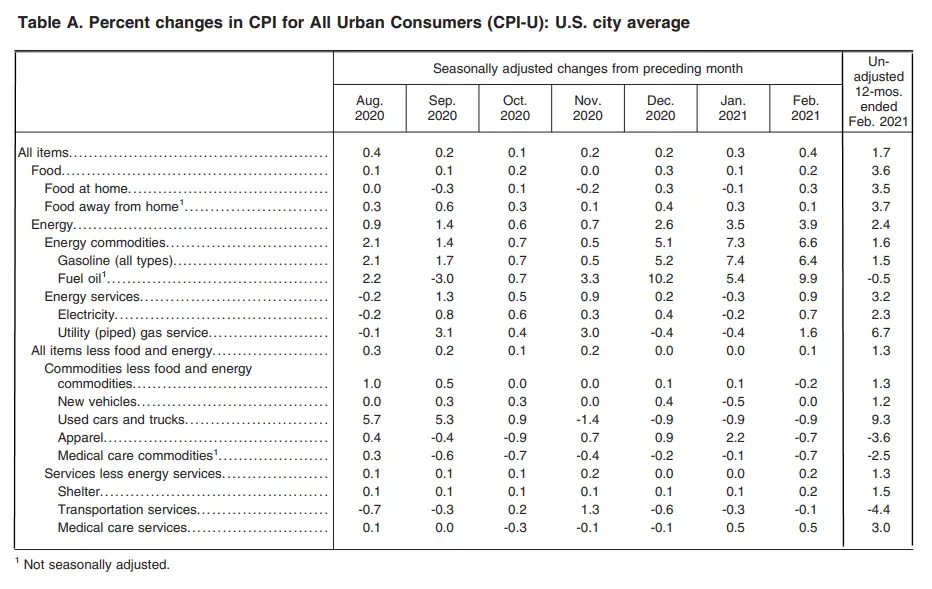
“The Consumer Price Index for All Urban Consumers (CPI-U) increased 0.4 percent in February on a seasonally adjusted basis after rising 0.3 percent in January, the U.S. Bureau of Labor Statistics reported today. Over the last 12 months, the all items index increased 1.7 percent before seasonal adjustment. The gasoline index continued to increase, rising 6.4 percent in February and accounting for over half of the seasonally adjusted increase in the all items index. The electricity and natural gas indexes also increased, and the energy index rose 3.9 percent over the month. The food index rose 0.2 percent. “
When we measure it to two decimals (on a non-adjusted basis) monthly inflation was 0.55% in February and annual inflation was 1.68% rather than 1.7%. Key components are the increase in Energy prices which increased 3.% over the last month but “only” 2.4% over the year. However, Gasoline and Fuel Oil increased much more at 6.4% and 9.9% in February alone. Although down for the month Used cars increased 9.3% over the year. For more information see the price changes in various components of the Consumer Price Index over the last 20 years.
Seasonally Adjusted Inflation Components Table
Annual Inflation Chart:
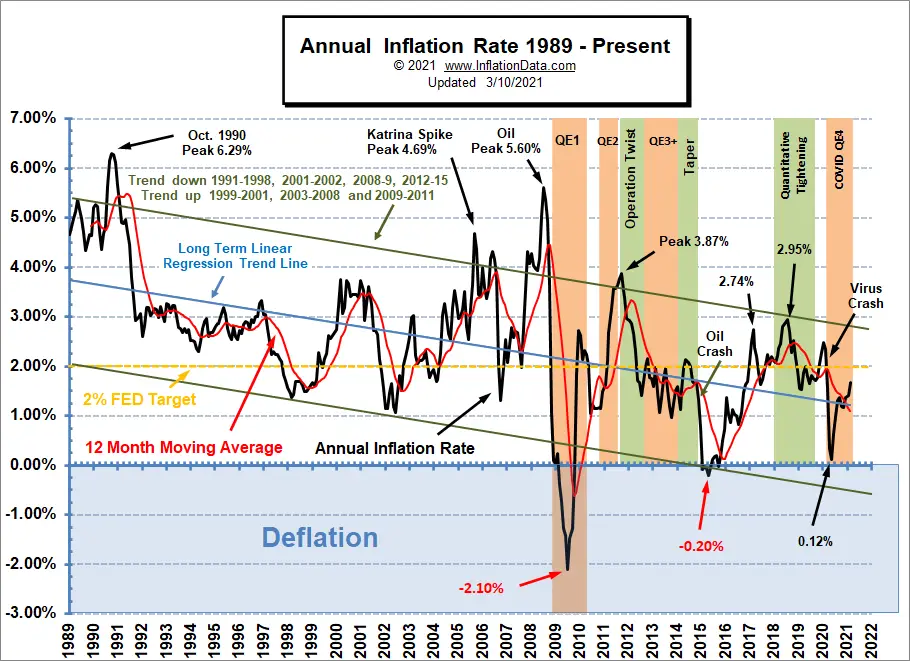
Annual inflation ticked up again and remains above its moving average and the linear regression line. Inflation will be making a comeback even though it is currently still below the FED’s 2% target. The long-term trend is still down from the October 1990 peak until it crosses decisively above the upper trendline and remains there.
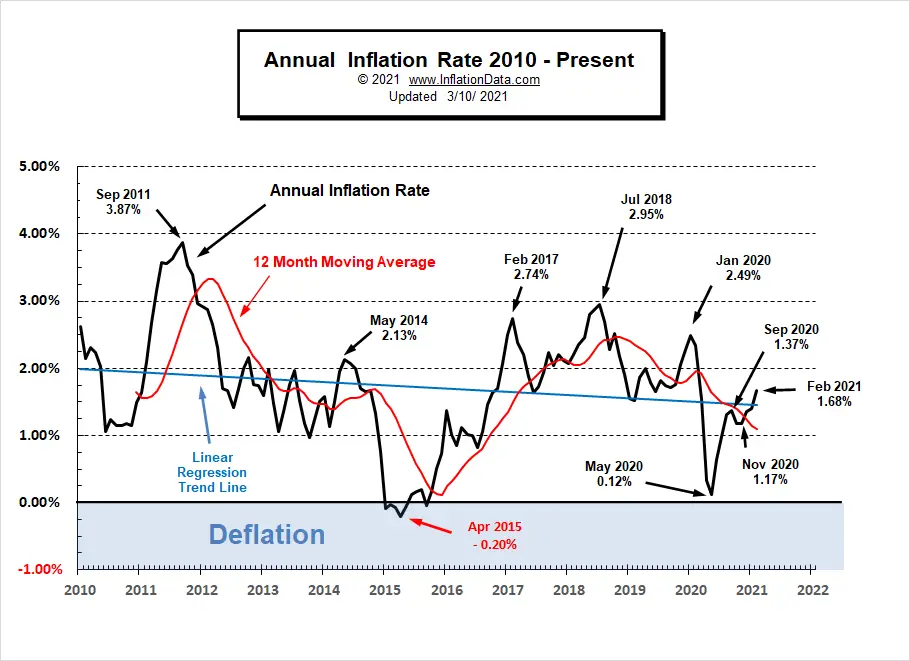
Current Inflation Situation
Looking at just the most recent 10 years the trend is less obvious. Inflation peaked in September 2011 at 3.87% and again in July 2018 at 2.95% and bottomed at -0.20% in April 2015 and at 0.12% in May of 2020. With the Linear Regression Line still tilted slightly downward we can see the trend is still down.
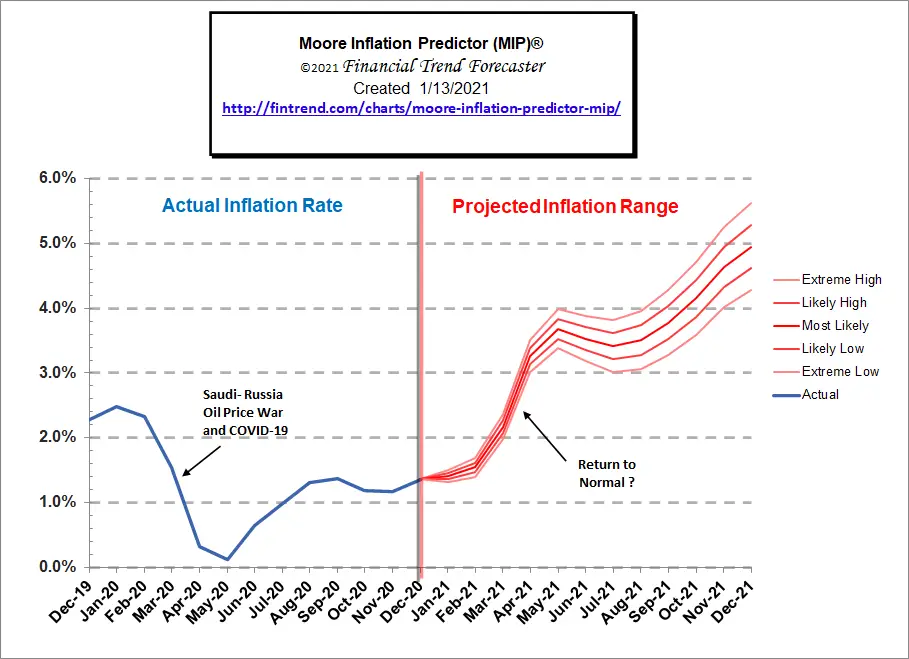
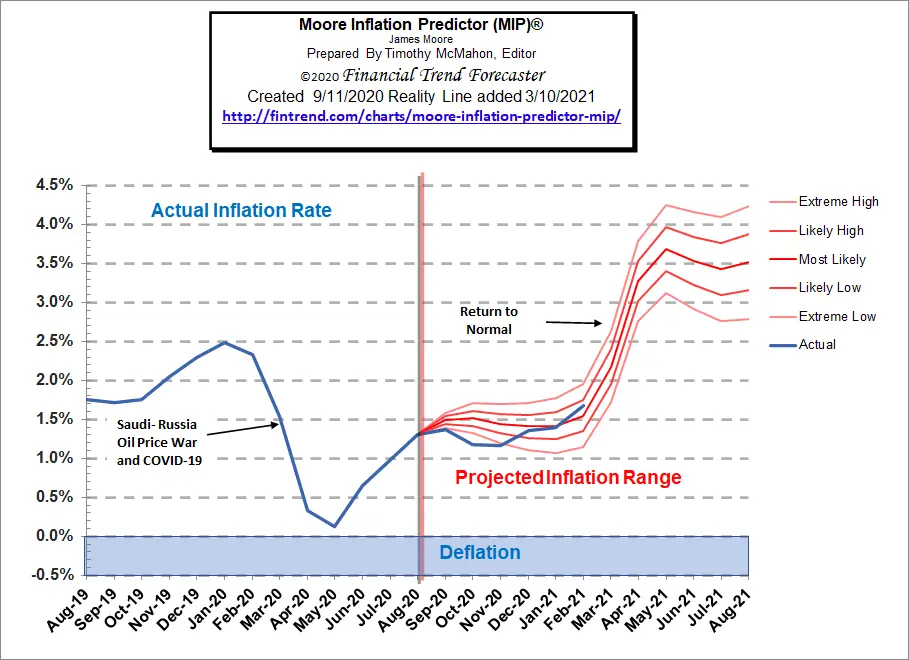
Moore Inflation Predictor (MIP)
The monthly inflation rate for January was 0.43%, which is pretty typical for January through May. December was 0.09% which sounds low but considering the 4th quarter is typically negative anything positive is actually high. February was a robust 0.55%.
Typically the majority of the inflation occurs in the first 5 months of the year and then the summer months are moderate and the Fall months are low to negative (i.e. deflationary) but 2020 turned everything upside down with March and April being massively deflationary and the summer months being inflationary. The 4th quarter was pretty typical but not as deflationary as it could have been.
Back in September, we created this chart projecting a massive spike coming in March and April. So far this projection has been pretty close with December through February tracking almost exactly on the “most likely” line.
See: Moore Inflation Predictor for current info
Not Seasonally Adjusted Monthly Inflation Rates
Monthly inflation for June was 0.55% comprising the majority of the annual inflation since March and April’s deflation canceled out much of the rest of the year’s inflation and now in February, we got another 0.55%.
| Jan | Feb | Mar | Apr | May | Jun | Jul | Aug | Sep | Oct | Nov | Dec | |
| 2016 | 0.17% | 0.08% | 0.43% | 0.47% | 0.41% | 0.33% | (0.16%) | 0.09% | 0.24% | 0.12% | (0.16%) | 0.03% |
| 2017 | 0.58% | 0.31% | 0.08% | 0.30% | 0.09% | 0.09% | (0.07%) | 0.30% | 0.53% | (0.06%) | 0.002% | (0.06%) |
| 2018 | 0.54% | 0.45% | 0.23% | 0.40% | 0.42% | 0.16% | 0.01% | 0.06% | 0.12% | 0.18% | (0.33%) | (0.32%) |
| 2019 | 0.19% | 0.42% | 0.56% | 0.53% | 0.21% | 0.02% | 0.17% | (0.01%) | 0.08% | 0.23% | (0.05%) | (0.09%) |
| 2020 | 0.39% | 0.27% | (0.22%) | (0.67%) | 0.002% | 0.55% | 0.51% | 0.32% | 0.14% | 0.04% | (0.06%) | 0.09% |
| 2021 | 0.43% | 0.55% |
See: Monthly Inflation Rate for more information and a complete table of Unadjusted Monthly Rates.
For more information See Annual Inflation.
Federal Reserve Actions
According to the National Bureau of Economic Research (NBER) the U.S. has been in a recession since February (shaded area) after the longest boom in economic history. According to NBER the peak occurred in February 2020. Often their peaks will take a long time before people realize that things are not going well. It is, however, possible that the “recession” will be short-lived if the economy can get back on track especially in light of all the FED money pumping going on.
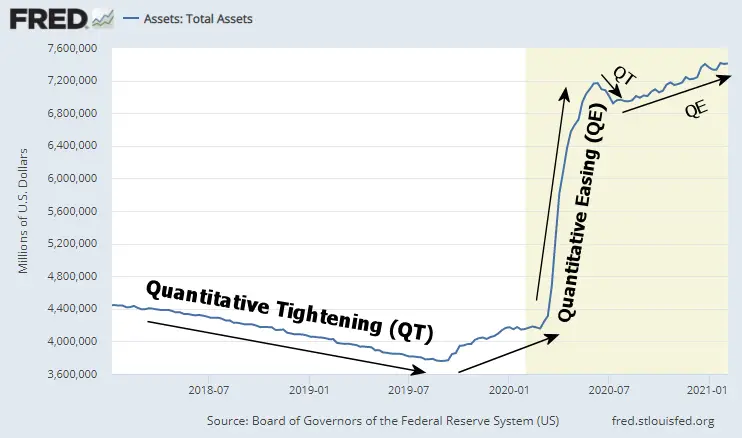
In the following chart, we see the Federal Reserve Total Assets.
After the massive QE increase beginning in March, the FED tried tightening from June 10th through July 8th, 2020. That small QT caused concern among many market analysts but then the money began flowing again… as we saw a progressive increase through year-end. See NYSE ROC for more info.
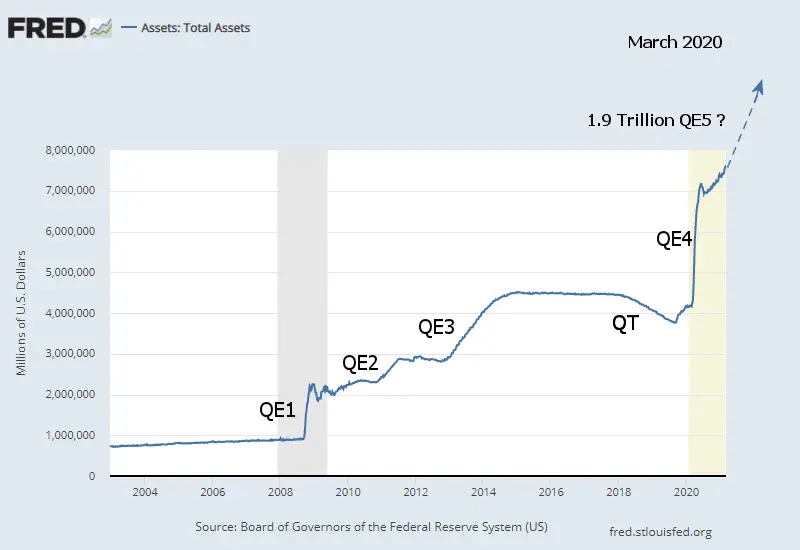
If we take a longer term view we can see the size and frequency of the previous Quantitative Easings, each of which created a progressively larger jump in FED assets. QE1 took FED assets from below 1 Trillion to over 2 Trillion. By the end of QE2 FED assets were almost 3 Trillion. QE3 took it to 4.5 Trillion and then the FED tried tightening bringing assets slightly below 4 Trillion. But then along came QE4 and FED assets jumped straight to over 7 Trillion… growth slowed for a bit and then steadily climbed above 7.5 Trillion. If we add another 1.9 Trillion as Congress is currently contemplating that will take FED Assets to around 9.4 Trillion… almost 10 Times what it was in 2008. Although previous “Easings” have not resulted in massive inflation that is primarily because the effects were directed toward massive monetary collapses (stock market). If there is no collapse will the money go into commodities (raising prices) or the stock market or both?
Currently, FED assets are primarily composed of 2.1 Trillion in Mortgage Backed Securities, and 4.86 Trillion in U.S. Treasury Securities. Source: St. Louis FED
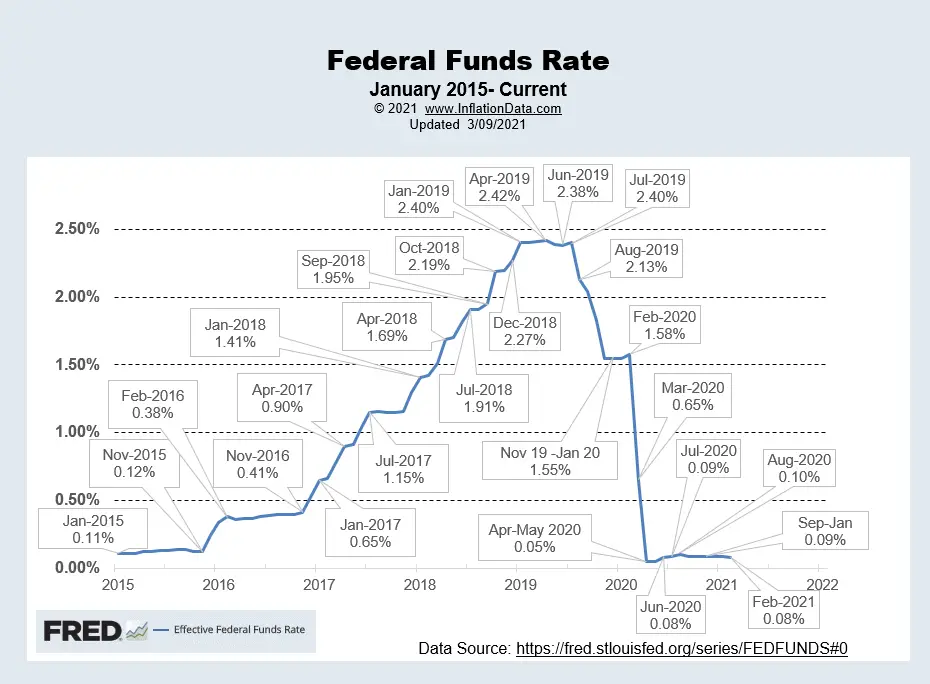
FED Funds Rate
In the chart below, we can see that the FED Funds Rate peaked at 2.42% in April 2019 then the FED began fearing that it was holding too tight and the stock market was suffering so it began easing. It leveled off in November at 1.55% where it stayed until February. At that point, COVID tanked the market, and the FED loosened rates to virtually zero (actually 0.05%) five one-hundredths of a percent. In June they moved it up to eight one-hundredths of a percent and then in July, it inched up another one-hundredth of a percent. Then in August, it moved up another one-hundredth of a percent to 0.10% (i.e. one-tenth of 1%). Interestingly, even that was too high because they lowered it in September back to 0.09% where it remained through January 2021. In February the FED lowered the FED Funds Rate back to 0.08%. Chart Source St Louis FED.
For more info See NYSE ROC and MIP.
Misery Index
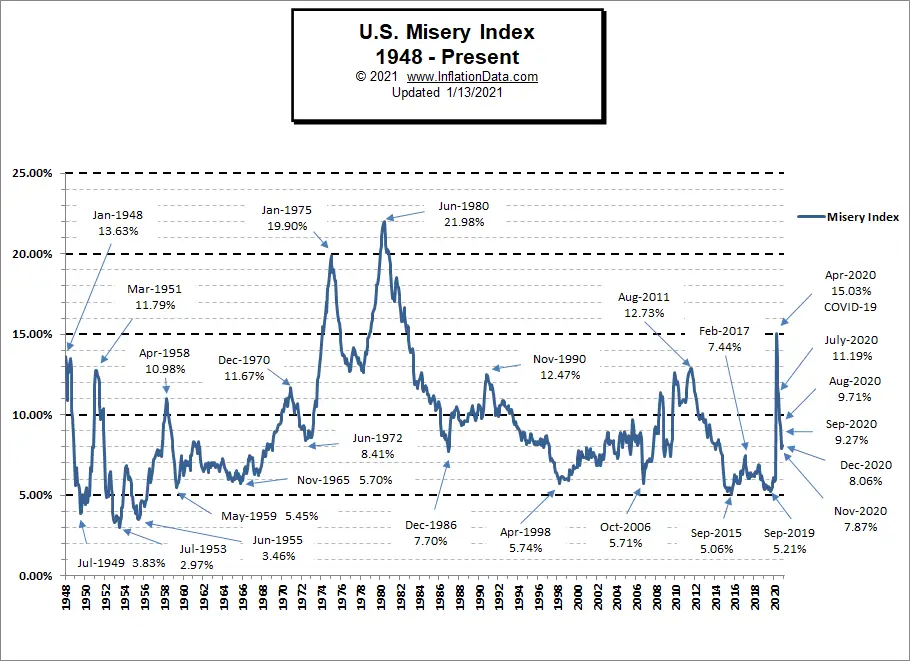 In September 2019, the Misery index bottomed near all-time lows at 5.21%.
By March 2020, it had climbed slightly to 5.94%. But in April, due to the COVID-19 shutdown and consequent high unemployment, the Misery Index shot up to 15.03% based on 14.7% unemployment and 0.33% inflation.
[Read More…]
NYSE Rate of Change (ROC)©

Hold? Signal (Whipsaw)
This month’s NYSE ROC chart shows a massive spike due to comparing against the “V” shaped COVID drop of March 2020.
See the NYSE ROC for more info.
NASDAQ Rate of Change (ROC)©

Hold Signal!
The NASDAQ ROC also spiked up drastically.
See NASDAQ ROC for more.
Regional Inflation Information
The U.S. Bureau of Labor Statistics also produces regional data. So if you are interested in more localized inflation information you can find it here.
| AL | AK | AR | AZ | CA | CT | CO | DC | DE | FL | GA | GU | HI | IA |
| ID | IL | IN | KS | KY | LA | MA | MD | ME | MI | MN | MO | MS | MT |
| NC | ND | NE | NH | NJ | NM | NV | NY | OH | OK | OR | PA | PR | RI |
| SC | SC | SD | TX | UT | VA | VI | VT | WI | WA | WI | WV |
You Might Also Like:
From InflationData.com
- January Inflation Setting Stage for Big Run Up
- Price and Wage Changes since 2000
- Why Hasn’t the U.S. Dollar Experienced Hyperinflation?
- Using Risk to Combat Inflation
From UnemploymentData.com.
- How to Appear Highly Professional in an Interview
- Start a Career in Financial Risk Management
- Things to Consider When Opening Your Restaurant
- How to Go Back to School as an Adult: The Steps Explained
- Create a Professional Resume
- How to Get a Job with No Experience
- Turning Unemployment to Success
From Financial Trend Forecaster
- Ripple the Cryptocurrency of Banks
- The Future of U.S. Energy Independence
- Top Financial Trends Shaping Banking
- The Death Of U.S. Shale Has Been Greatly Exaggerated
From Elliott Wave University
- Bitcoin: Let’s Put 2 Heart-Pounding Price Drops into Perspective
- Spotting the Slide in Silver
- Market Participants are Extremely Bullish
- Why Most Investors Miss Major Stock Market Turns
- This High-Confident Trade Set-up Makes for Highly-Confident Traders
From OptioMoney.com
- Top 7 Most Affordable U.S. Cities to Live In
- A Beginner’s Guide to Investing: 4 Major Dos & Don’ts
- Smart Finance Moves: Questions to Ask Yourself Before You Buy a New Car
- Wealth Transfer: Estate Planning
- 5 Things to Consider When Managing Money in a Relationship
From Your Family Finances
- Eat for Cheap: What You Can Do to Make Filling Family Dinners Fit a Tight Budget
- Self-Employed Considerations To Ensure Financial Security
- 7 Benefits of Downsizing to a Smaller Home
- Reassessing Your Insurance Coverage: Are You Protected in Case of an Emergency?
- Key Factors To Consider Before Refinancing Your Home

Leave a Reply