
The Annual Inflation Rate exploded in October, according to the Bureau of Labor Statistics report.
Inflation Summary:
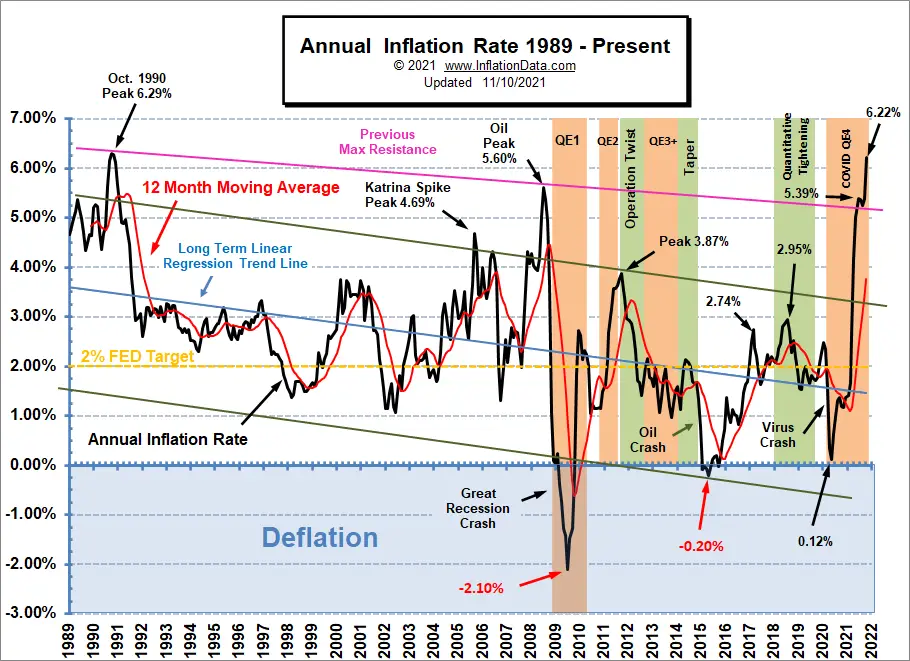
- Annual Inflation highest since October 1990.
- CPI Index rose from 274.310 to 276.589.
- Monthly Inflation for October was 0.83%
- Next release December 10th
Inflation for the 12 months ending in October was Up Sharply from September.
September 5.39% October 6.22%
Current levels have exploded through the pink resistance line. Exceeding the 5.60% Oil Peak of July 2008, and coming very close to the October 1990 peak at 6.29%.
If next month takes it up even slightly we will have to go all the way back to 1982 to see higher inflation.
BLS Commissioner’s Inflation Report:
According to the BLS commissioner’s report, “The Consumer Price Index for All Urban Consumers (CPI-U) increased 0.9 percent in October on a seasonally adjusted basis after rising 0.4 percent in September, the U.S. Bureau of Labor Statistics reported today. Over the last 12 months, the all items index increased 6.2 percent before seasonal adjustment. The monthly all items seasonally adjusted increase was broad-based, with increases in the indexes for energy, shelter, food, used cars and trucks, and new vehicles among the larger contributors. The energy index rose 4.8 percent over the month, as the gasoline index increased 6.1 percent and the other major energy component indexes also rose. The food index increased 0.9 percent as the index for food at home rose 1.0 percent. .”
Seasonally Adjusted Inflation Components Table
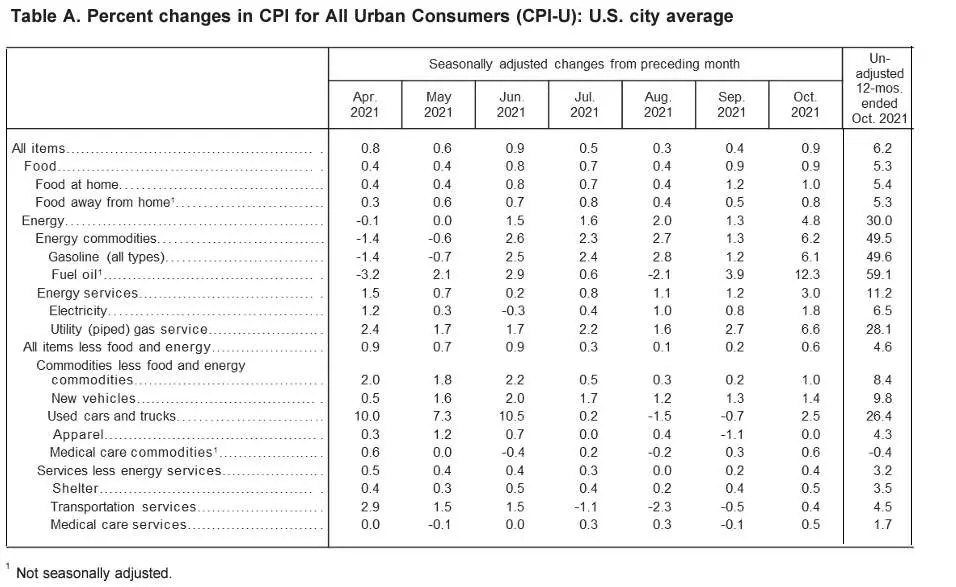 Key components are the increase in Gasoline prices which increased 6.1% over the last month and 49.6% over the last year. Used Cars and Trucks were also up 26.4% over year-ago prices. Food was up 5.3% over year-ago prices.
See: From Pandemic To 2021 Supply Chain Disruption for more information. We’ve also updated the Inflation Adjusted Corn prices chart.
October 2021 Inflation Situation
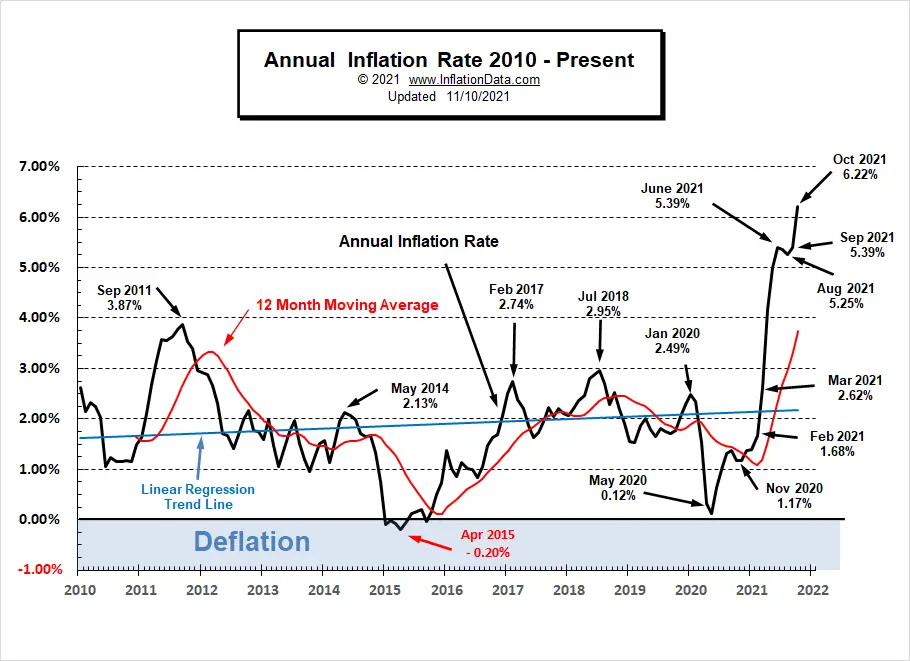
The Current Annual inflation Rate for the 12 months ending in October was 6.22% significantly above September’s 5.39%.
August was 5.25%, July was 5.37%, June was 5.39%. This followed the run-up from December 2020’s 1.36%. So inflation is much more than QUADRUPLE last December’s rate.
Monthly Inflation:
October’s monthly inflation was a massive 0.83%, compared to 0.04% in October 2020. Typically, October – December have extremely low (or even negative) monthly inflation so having a massive number like this is indicative of a shift toward much higher annual inflation.
 See Annual Inflation for more information.
Moore Inflation Predictor
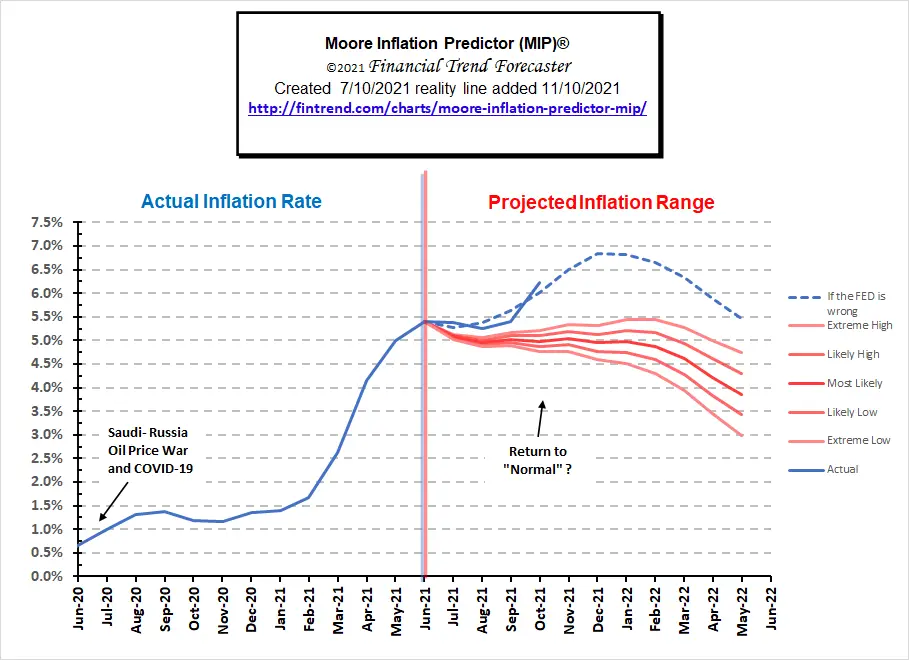
In March, we changed the projection model due to the FED’s pronouncements. FED chairman Jerome Powell insisted that inflation would not be a problem, i.e., that the spike was only “transitory”. So rather than using the extreme high (winter months projection numbers) we had been using, we switched back to “normal” Summer and Fall projections. But we added an additional line to project what was possible if the FED’s pronouncement was wrong. And even that number was too low for October’s projection but looking at the longer term we can see that our July projection (based on June data) looks pretty good now.
 See our Moore Inflation Predictor for this month’s projection.
Not Seasonally Adjusted Monthly Inflation Rates
As we can see from the table below, the monthly numbers for the 4th quarter of 2020 are very low. If 2021 numbers come in above those numbers, the annual inflation rate will rise.
| Jan | Feb | Mar | Apr | May | Jun | Jul | Aug | Sep | Oct | Nov | Dec | |
| 2016 | 0.17% | 0.08% | 0.43% | 0.47% | 0.41% | 0.33% | (0.16%) | 0.09% | 0.24% | 0.12% | (0.16%) | 0.03% |
| 2017 | 0.58% | 0.31% | 0.08% | 0.30% | 0.09% | 0.09% | (0.07%) | 0.30% | 0.53% | (0.06%) | 0.002% | (0.06%) |
| 2018 | 0.54% | 0.45% | 0.23% | 0.40% | 0.42% | 0.16% | 0.01% | 0.06% | 0.12% | 0.18% | (0.33%) | (0.32%) |
| 2019 | 0.19% | 0.42% | 0.56% | 0.53% | 0.21% | 0.02% | 0.17% | (0.01%) | 0.08% | 0.23% | (0.05%) | (0.09%) |
| 2020 | 0.39% | 0.27% | (0.22%) | (0.67%) | 0.002% | 0.55% | 0.51% | 0.32% | 0.14% | 0.04% | (0.06%) | 0.09% |
| 2021 | 0.43% | 0.55% | 0.71% | 0.82% | 0.80% | 0.93% | 0.48% | 0.21 | 0.27 | 0.83% |
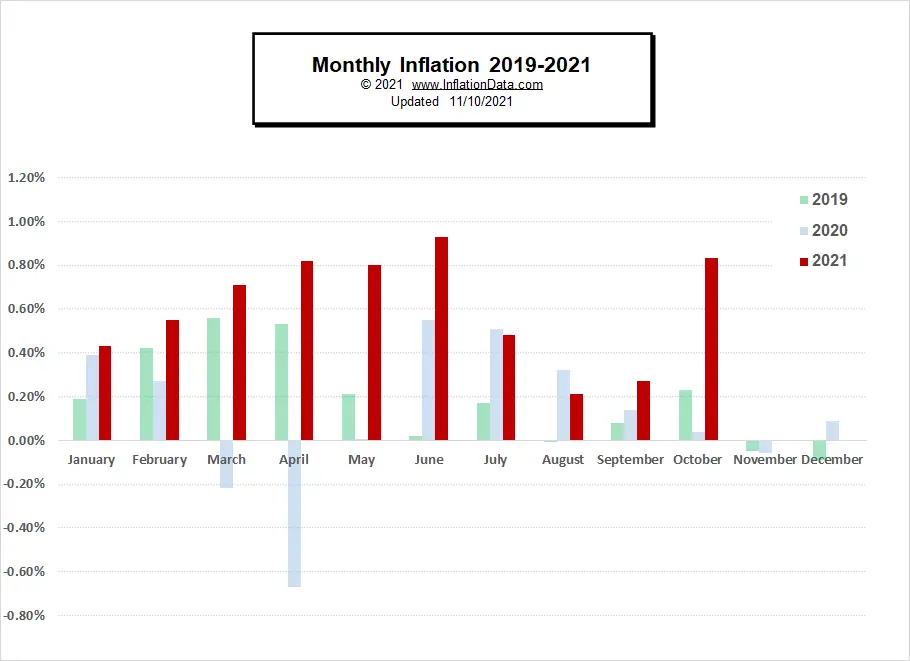
See: Monthly Inflation Rate for more information and a complete table of Unadjusted Monthly Rates.
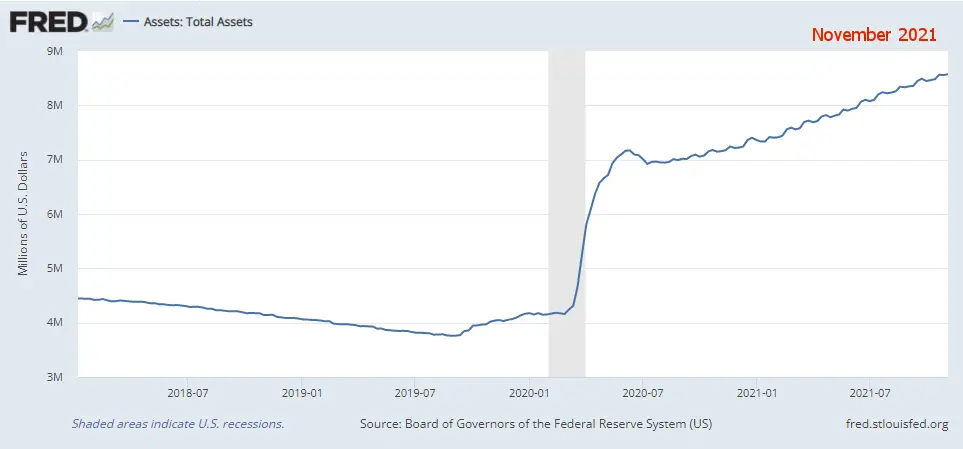
Federal Reserve Actions
The FED refused to commit to cutting back at their most recent meeting.
Despite the increase in inflation, the FED has announced that it won’t be tapering off its money printing until sometime next year. And tapering doesn’t even mean reducing assets, it only means printing slower. So it seems rather certain that inflation will continue. Looking at total assets, we can see the same stairstep pattern we’ve been seeing for the last year.
FED Funds Rate
As a matter of fact, they actually lowered the FED funds rate, albeit a minuscule 1/100% to 0.08% in September and it remained there in October.
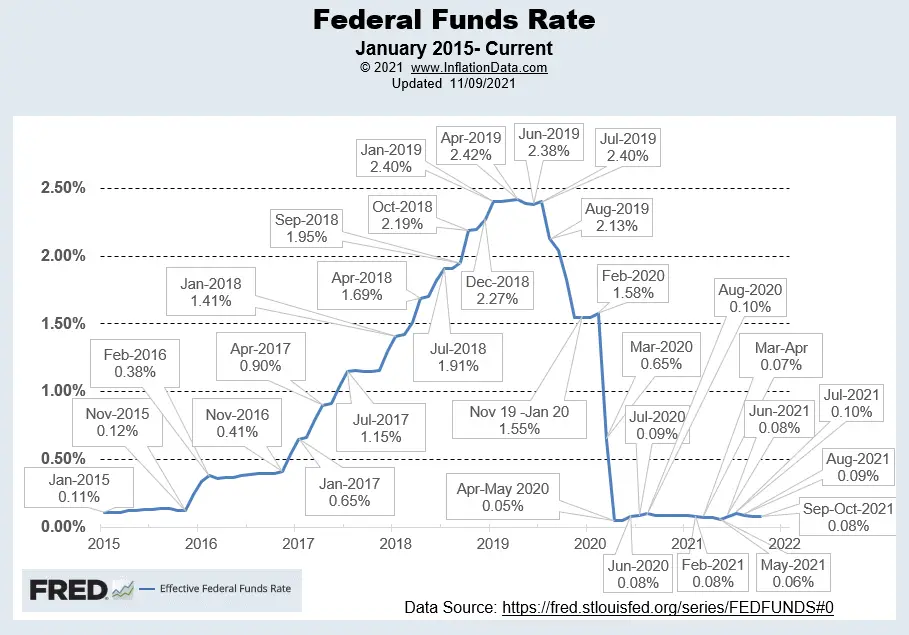 Chart Source St Louis FED.
For more info, See NYSE ROC and MIP.
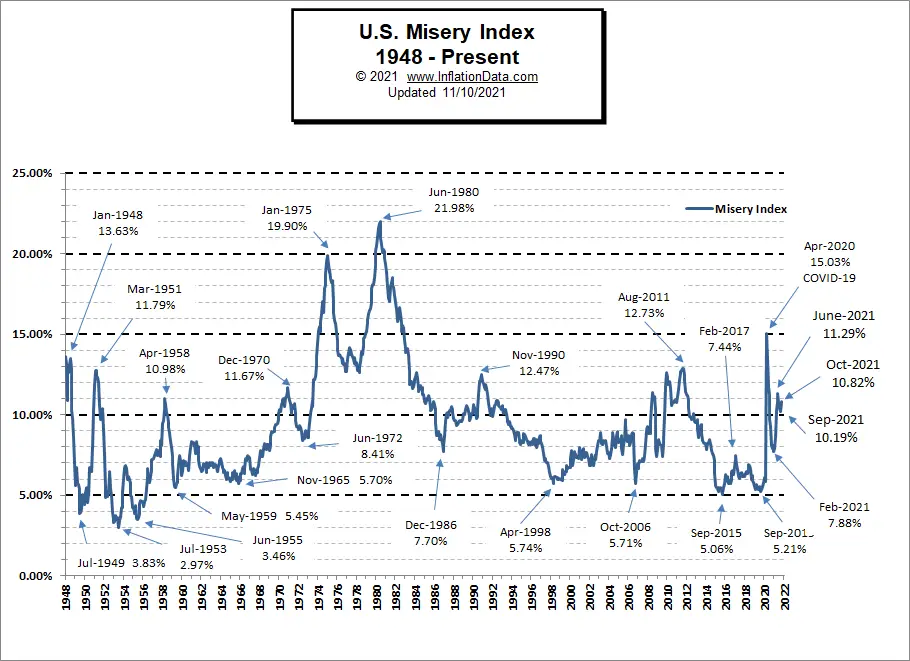
Misery Index
The misery index rose. Even though unemployment was down, inflation was up more than unemployment was down.
 [Read More…]
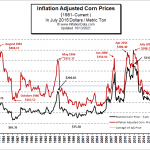 Inflation-Adjusted Price of Corn
We’ve updated the inflation-adjusted price of corn chart.
See: Inflation-Adjusted Price of Corn
NYSE Rate of Change (ROC)©

Sell or Hold? Signal
The NYSE ROC index is up but still below its moving average.
See the NYSE ROC for more info.
NASDAQ Rate of Change (ROC)©

Sell Signal
The NASDAQ ROC, up but still well below its moving average.
See NASDAQ ROC for more.
You Might Also Like:
From InflationData.com
- How Foreign Currencies Act as an Inflation Hedge
- How Insidious Inflation Affects the Affordability of Tuition and Fees
- Do Housing Prices Always Go Up?
- The Travel Industry, the Pandemic and U.S. Inflation
- Why is a Little Bit of Inflation Considered Good for the Economy?
- FED Issues September 2021 Statement
- How to Prepare for Inflation
- Safe-Haven Investments that Protect Your Capital From Rising Inflation
- 9 Inflation Books You Must Read
- Hyperinflation Strikes Lebanon… Again
From UnemploymentData.com.
- October 2021 Unemployment Down as Expected
- The Spectacular Benefits of a Sales And Marketing Career
- Got A New Job Out Of State? How To Find A New Home Fast
- Save Money by Getting Disability Insurance Through Your Work
From Financial Trend Forecaster
- 5 Revolutionary Developments in the Financial Industry
- How Is Technology Affecting Global Trading Markets
- Why Wearable Brand Merchandise is On Trend
- From Pandemic To 2021 Supply Chain Disruption
- Batteries: New Sea-Water Based Battery to Replace Lithium
- Farming: Discovering New Ways to Feed the Planet
- Fintech: The New Financial Management Disruptive Technology
- Record Credit Card Debt Reduction
- The Making of the Next Housing Crisis
- Which is Over Priced? Oil or Gold?
- What are NFTs, and Why are They Going Crazy?
From Elliott Wave University
- A Change May Be Nigh for Real Estate
- Will China’s Crackdown Send Bitcoin’s Price Tumbling?
- Why a Financial “Panic” May Be Just Around the Corner
- “Kiss of Death” Stock Market Indicator
- Will Oil Prices Skyrocket in the Aftermath of Hurricane Ida?
- Be Prepared “Or Else”
- The Maniacal Residential Real Estate Market
- Why the Stock Market is the True “Great Deceiver”
From OptioMoney.com (New Look)
- Creative Ways to Make Money In Retirement
- Covering the Cost of Cancer
- What to Consider When Shopping for Health Insurance
- How Does Bitcoin Mining Work? The Ultimate Guide
- Moving to a Cheaper City: Is It Worth It?
From Your Family Finances (New Look)
- Start Your Kids Right with a Credit Union Account
- Make Sure You’re Protected from the Unexpected
- When You Should Not Trade-In Your Car
- Could Moving to a Small Town Save You Money?
- Should You Buy A Home With Cracks In The Foundation?
- 5 Ways You Can Save More Money Every Month
- Bargain Retirement Overseas in Malaysia?
- How to Prepare Your Finances for Life Changes
- How Modern Tech Can Enhance Your Real Estate Investing
- How Making Small Car Repairs Can Save You Money in the Future

WHY WAS INFLATION SO HIGH IN REAGANS FIRST TERM .
Excellent question. But not easy to answer in a few words. A lot of factors were building up since the original Bretton Woods agreement which took the world off the Gold standard and put it on the Dollar standard and the Dollar was supposedly convertible into a fixed amount of gold i.e. $35 an ounce. See: https://inflationdata.com/articles/2014/05/30/oil-petrodollars-gold/ for more information on this. In the 1960s Johnson began a spending spree in the name of Social programs which inflated the currency and eventually Nixon was forced to admit that the dollar was no longer worth that much.
See: https://inflationdata.com/articles/inflation-cpi-consumer-price-index-1970-1979/. So Reagan was left with a mess to clean up so he did what was hard and put the U.S. back on a firm footing which carried all the way through the Clinton years.