
The U.S. Bureau of Labor Statistics released their Consumer Price Index News Release for the month of July on August 11th, 2021.
Inflation Summary:
- Annual Inflation 5.37% virtually identical to June’s 5.39%
- CPI Index rose from 271.696 in June to 273.003 in July.
- Monthly Inflation for June was 0.93% and July was 0.48%.
- Next release September 14th
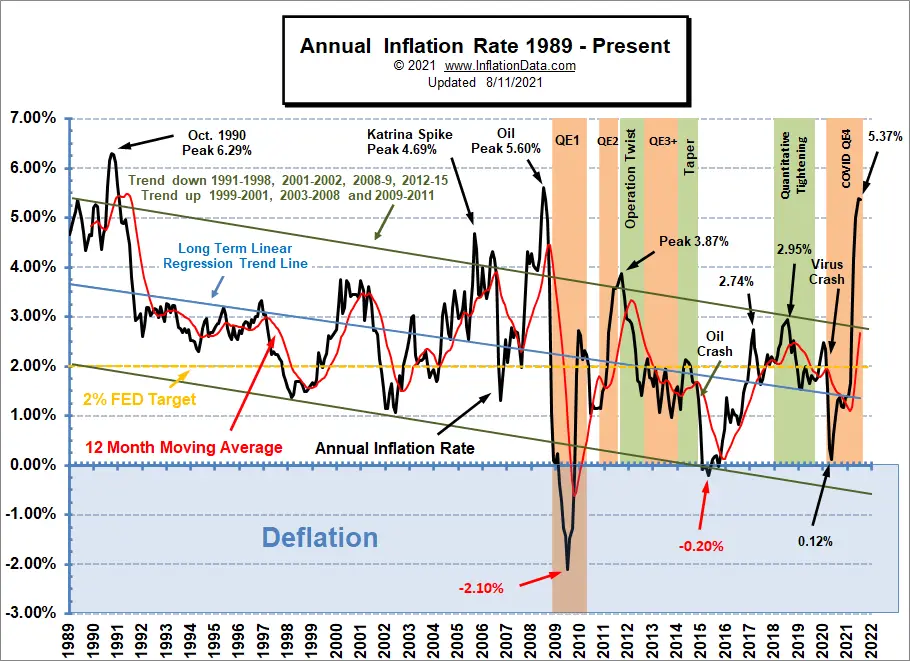
Inflation for the 12 months ending in July was 5.37% identical to August 2008, July 2008 was the previous Peak at 5.60%
Last month’s 5.39% was the largest increase since August 2008’s 5.37%. (Since the BLS rounds to 1 decimal place they reported last month, this month, and August 2008 as 5.4%). If inflation tops the 5.6% of July 2008, we have to go all the way back to the 6.29% of October 1990 to find a higher peak.
We’ve been predicting Annual Inflation would shoot up in 2021 since September 2020 despite FED Chairmen Jerome’s pronouncement that inflation was “transitory”.
BLS Commissioner’s Inflation Report:
According to the BLS commissioner’s report, “The Consumer Price Index for All Urban Consumers (CPI-U) increased 0.5 percent in July on a seasonally adjusted basis after rising 0.9 percent in June, the U.S. Bureau of Labor Statistics reported today. Over the last 12 months, the all items index increased 5.4 percent before seasonal adjustment. The indexes for shelter, food, energy, and new vehicles all increased in July and contributed to the monthly all items seasonally adjusted increase. The food index increased 0.7 percent in July as five of the major grocery store food group indexes rose, and the food away from home index increased 0.8 percent. The energy index rose 1.6 percent in July, as the gasoline index increased 2.4 percent and other energy component indexes also rose.”
(But remember when they talk about monthly numbers they are talking about “seasonally adjusted rates” while Annual numbers can’t be “Seasonally Adjusted”).
Seasonally Adjusted Inflation Components Table
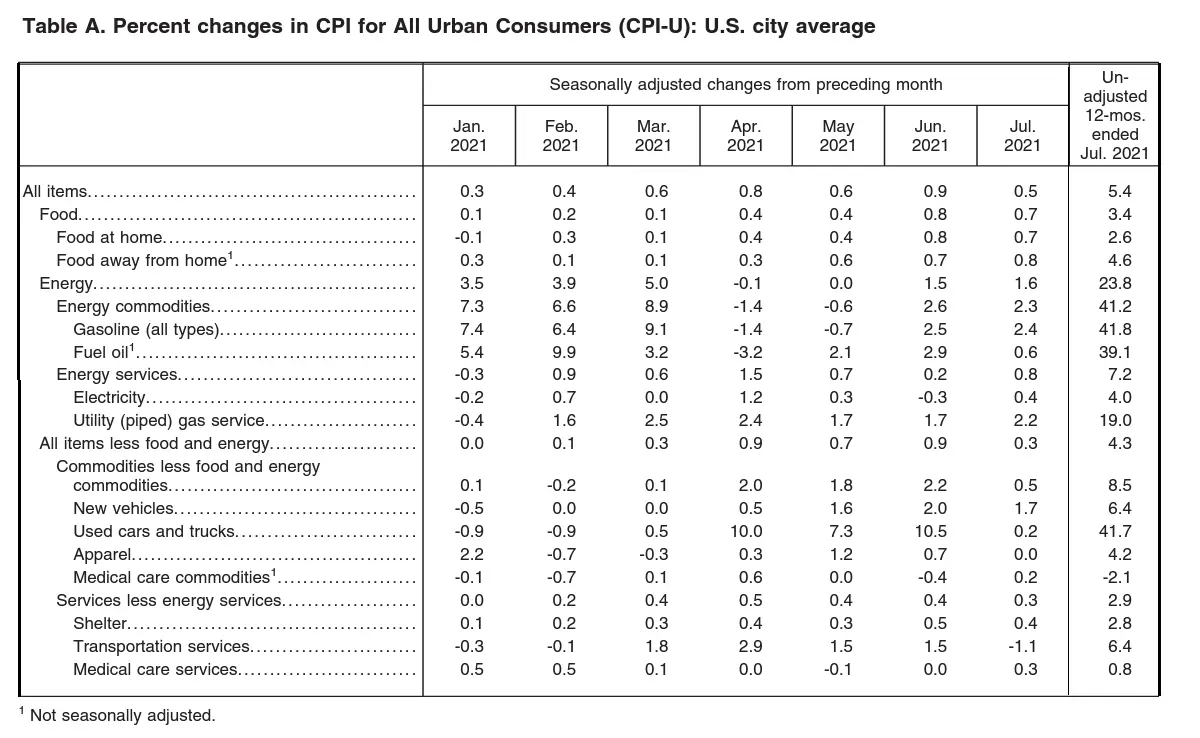 As we can see from the table above key components are the increase in Energy prices which increased 23.8% over the last year and is up 1.6% over the last month. Used Cars and Trucks were also up 41.7% over year-ago prices. Food was up 3.4% over year-ago prices.
Current Inflation Situation
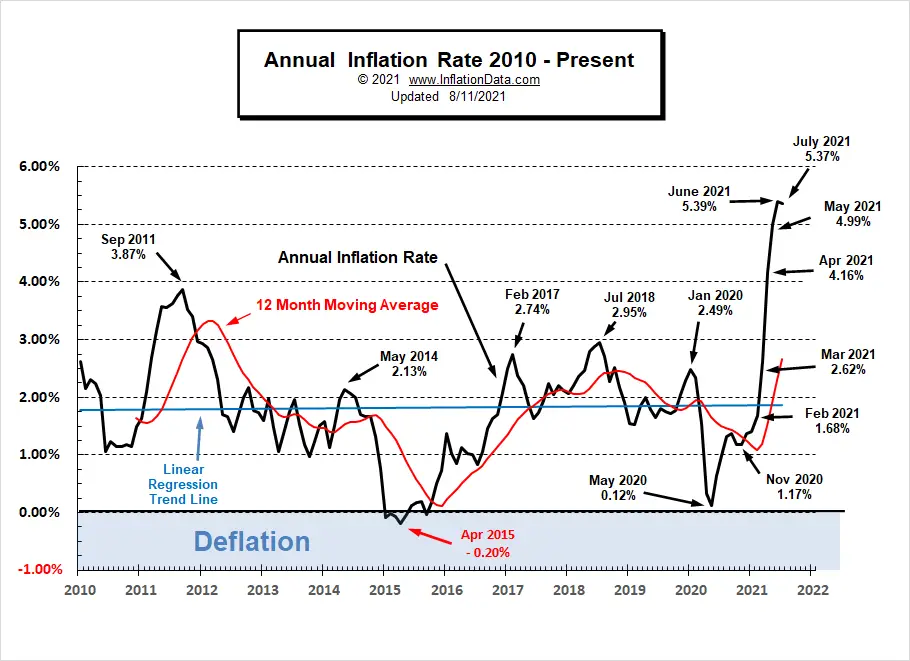
Looking at just the most recent years since 2010, we can see that the current levels are much higher than the 4 previous peaks since September 2011.
Moore Inflation Predictor
For the last couple of months, we’ve said that the FED’s projection of “transitory” inflation was overly optimistic and we included an additional line on our MIP Chart “if the FED is wrong”. On last month’s MIP chart that line was very close to perfect (although even that was a little low).
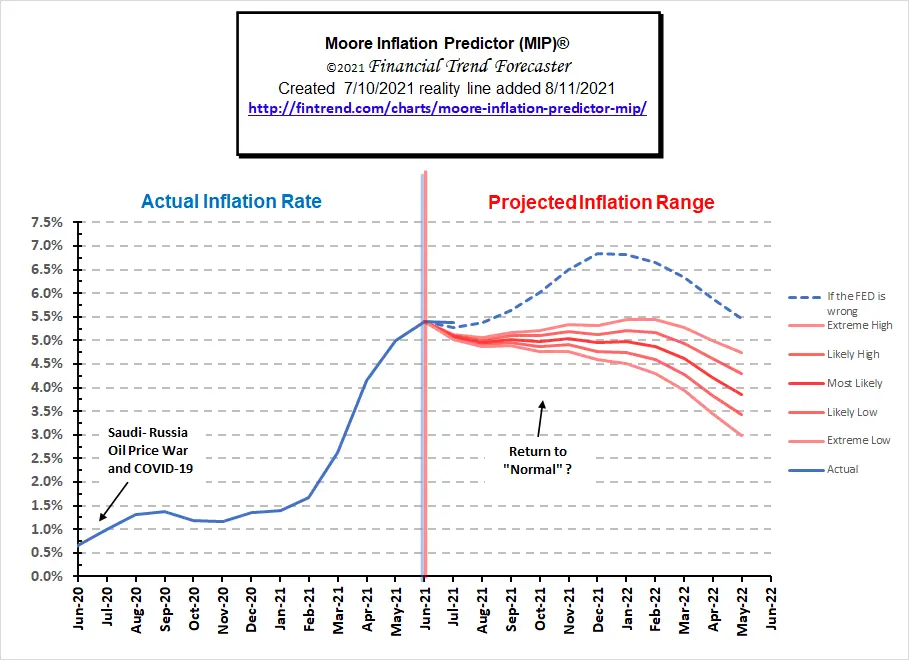
See: Moore Inflation Predictor for current info.
Not Seasonally Adjusted Monthly Inflation Rates
We can see from the table below that every month so far in 2021 is higher than the corresponding month in either 2019 or 2020.
| Jan | Feb | Mar | Apr | May | Jun | Jul | Aug | Sep | Oct | Nov | Dec | |
| 2016 | 0.17% | 0.08% | 0.43% | 0.47% | 0.41% | 0.33% | (0.16%) | 0.09% | 0.24% | 0.12% | (0.16%) | 0.03% |
| 2017 | 0.58% | 0.31% | 0.08% | 0.30% | 0.09% | 0.09% | (0.07%) | 0.30% | 0.53% | (0.06%) | 0.002% | (0.06%) |
| 2018 | 0.54% | 0.45% | 0.23% | 0.40% | 0.42% | 0.16% | 0.01% | 0.06% | 0.12% | 0.18% | (0.33%) | (0.32%) |
| 2019 | 0.19% | 0.42% | 0.56% | 0.53% | 0.21% | 0.02% | 0.17% | (0.01%) | 0.08% | 0.23% | (0.05%) | (0.09%) |
| 2020 | 0.39% | 0.27% | (0.22%) | (0.67%) | 0.002% | 0.55% | 0.51% | 0.32% | 0.14% | 0.04% | (0.06%) | 0.09% |
| 2021 | 0.43% | 0.55% | 0.71% | 0.82% | 0.80% | 0.93% | 0.48% |
See: Monthly Inflation Rate for more information and a complete table of Unadjusted Monthly Rates.
For more information See Annual Inflation.
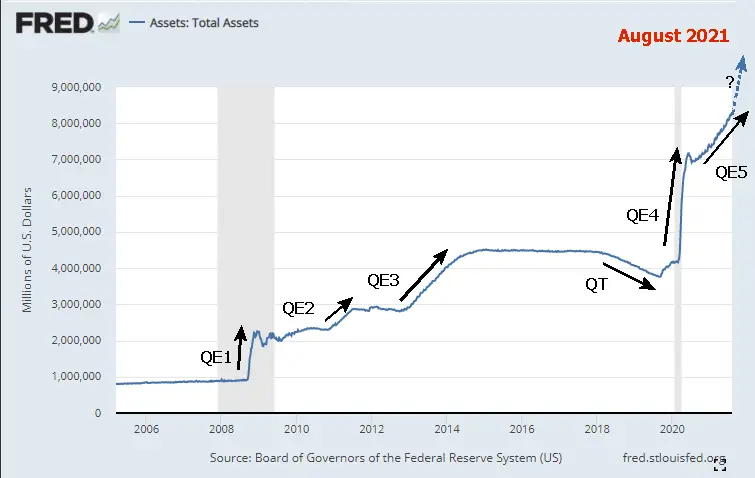
Federal Reserve Actions
If you think this inflation is bad just wait until the FED pumps in another 1.25 Trillion into the economy. See NYSE ROC for more info.
FED Funds Rate
The FED has raised the FED funds a few hundredths of a percent since May, which is more symbolic than effective. The current FED Funds rate is 0.10% up from 0.08% in May. It has ranged from 0.05% to current levels since April 2020.
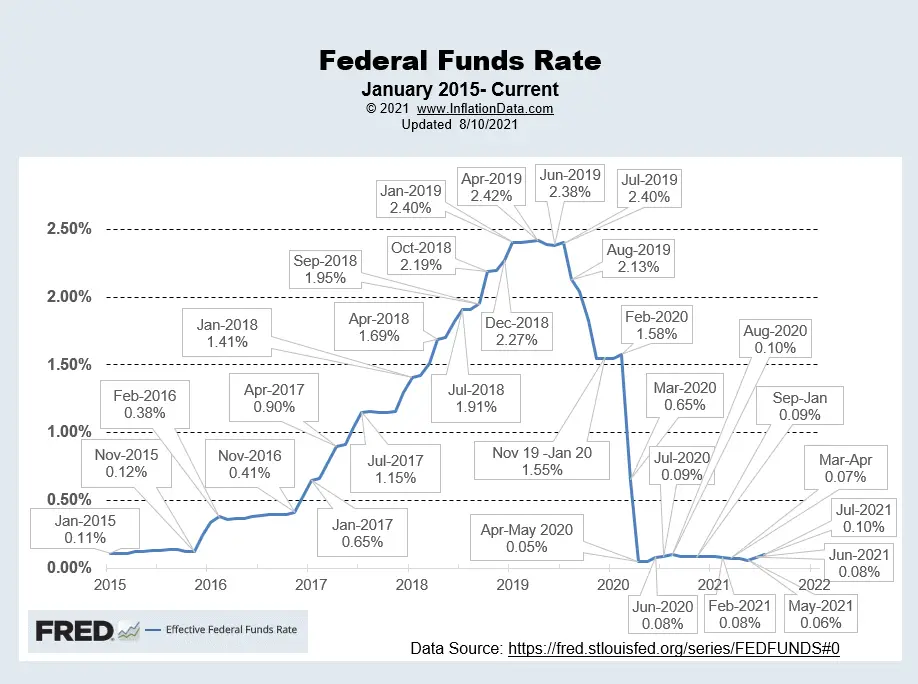 Chart Source St Louis FED.
For more info See NYSE ROC and MIP.
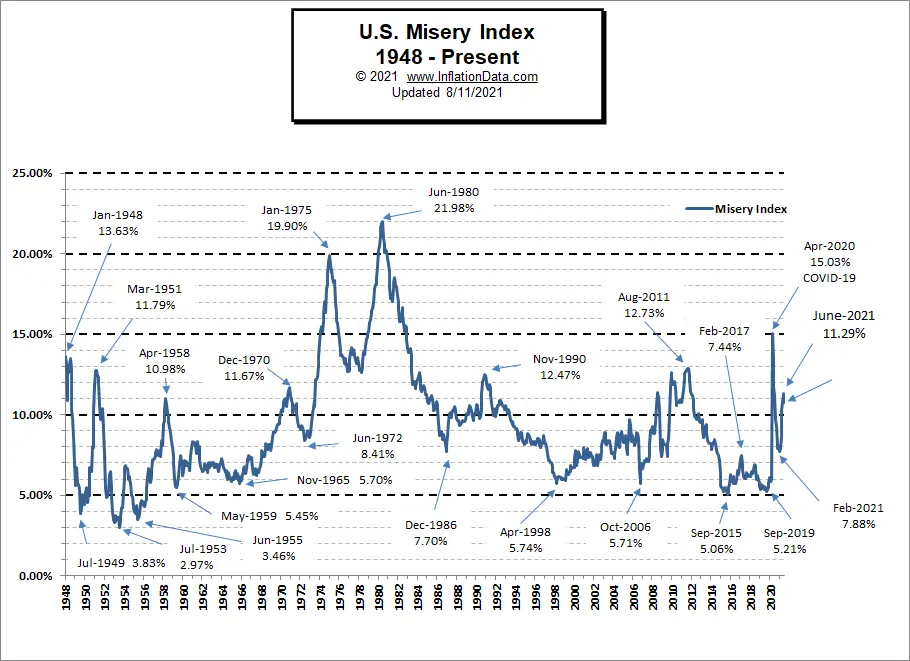
Misery Index
The misery index spiked along with the inflation rate.
[Read More…]
NYSE Rate of Change (ROC)©

Hold? Signal (Whipsaw)
The NYSE ROC index is down but still above its moving average.
See the NYSE ROC for more info.
NASDAQ Rate of Change (ROC)©

Hold Signal????
The NASDAQ ROC on the other hand has fallen below its moving average.
See NASDAQ ROC for more.
Regional Inflation Information
The U.S. Bureau of Labor Statistics also produces regional data. So if you are interested in more localized inflation information you can find it here.
| AL | AK | AR | AZ | CA | CT | CO | DC | DE | FL | GA | GU | HI | IA |
| ID | IL | IN | KS | KY | LA | MA | MD | ME | MI | MN | MO | MS | MT |
| NC | ND | NE | NH | NJ | NM | NV | NY | OH | OK | OR | PA | PR | RI |
| SC | SC | SD | TX | UT | VA | VI | VT | WI | WA | WI | WV |
You Might Also Like:
From InflationData.com
- The Relationship Between Inflation and Interest Rates: Explained
- How Can Inflation Affect Businesses?
- Inflation and Bonds
- June 2021: Highest Annual Inflation since 2008
- Oil vs. Gold- Why Compare Commodity Prices Against Each Other?
From UnemploymentData.com.
- Transform Your Career by Passing Microsoft AZ-900 Certification Exam
- Unemployment Falls in July
- Getting Cisco Certified to Improve Your Job Prospects
- Protect Your Business Against Lawsuits
- 4 Finance Jobs That Can Make a Great Career
From Financial Trend Forecaster
- Record Credit Card Debt Reduction in 2020-1
- The Making of the Next Housing Crisis
- Which is Over Priced? Oil or Gold?
- What are NFTs and Why are They Going Crazy?
- Is Bitcoin Headed For a Fall?
From Elliott Wave University
- Why the Stock Market is the True “Great Deceiver”
- High “Beta” stocks … “Meme” stocks… and Index stocks… Oh My!
- Why U.S. Corporate Bankruptcies Could Skyrocket
- Why “Trouble is Brewing” for the U.S. Housing Market
- The Fear of Missing Out
From OptioMoney.com (New Look)
- A Unique Way to Create Extra Income
- How Your Credit Score Affects You and Your Family
- Tips For Renting Out a Room In Your House
- How to Prepare to Apply for a Mortgage When You Are Self-Employed
- How to Minimize Complications When Reducing Your Mortgage
From Your Family Finances
- How to Determine if You Qualify for Social Security Disability
- Intro to Home Additions
- Should You Say That? Tips for Talking to Insurance Companies After an Accident
- Essential Car Maintenance Costs
- How to Help Your Children Afford Their First Home

Leave a Reply