• Home
  • Related Sites
    • Financial Trend Forecaster
      • Moore Inflation Predictor
      • NYSE Rate of Change (ROC)
      • NASDAQ Rate of Change (ROC)
      • Crypto ROC- BTC & ETH
    • Unemployment Data
      • Historical Employment Data
      • Unemployment Rate Chart
      • Labor Force Participation Rate
    • Optio Money
    • Elliott Wave University
    • More Resources
  • Definitions
    • What is Inflation?
    • What is Core Inflation?
    • Inflation vs CPI
    • What is Deflation?
    • What is Disinflation?
    • What is Agflation?
    • What is Stagflation?
    • What is Hyperinflation?
    • What is Quantitative Easing?
    • What is Quantitative Tightening?
    • What is Velocity of Money?
    • What is Fiat Currency?
    • How Do I Calculate Inflation?
    • What are “Sticky Prices” and Why Do They Matter?
  • Featured Content
  • About Us
  • Feedback
    • Sitemap
  • Subscribe Now

InflationData.com

Your Place in Cyber Space for Inflation Data

CPIWidget-Feb26
  • Numerical Inflation Data
    • Current Inflation Rate
    • Monthly Inflation Rate (Moved)
    • Historical U.S. Inflation Rates
    • Historical CPI
  • Inflation Charts
    • Ann. Inf. Rate Chart
    • Long Term Inflation >
      • Ave. Inf. by Decade
      • Total Inf. by Decade
      • Inflation 1913-1919
      • Inflation 1920-1929
      • Inflation 1930-1939
      • Inflation 1940-1949
      • Inflation 1950-1959
      • Inflation 1960-1969
      • Inflation 1970-1979
    • Cumulative Inflation
    • FED Monetary Policy and Inflation
    • Inflation and Recession
    • Confederate Inflation (1861 – 1865)
    • Misery Index
    • The 3 Stages of Inflation
    • 15-Yr Inflation Trends Chart
  • Inflation Calculators
    • Cumulative Inf. Calc.
    • How Much Would it Cost
    • Historical Inflation Calculator since 1774
    • Salary Inf. Calc.
    • U.K. Inf. Calc.
    • Cost of Gas Calc.
    • Net Worth Calc.
    • Lifetime Earnings Calc.
    • Savings Goal Calc.
    • Financial Calculators
  • Inf. Adjusted Prices
    • Energy >
      • Inflation Adj. Gas Prices
      • Historical Oil Prices Chart
      • Crude Oil Price (Table)
      • Natural Gas Prices
      • Electricity Prices
      • Oil vs Gold
    • Gold >
      • Inflation Adjusted Annual Average Gold Prices
      • Gold is a “Crisis Hedge” not an  “Inflation Hedge”
      • Comparing Oil vs. Gold
    • Corn Prices
    • Education Inflation
    • Housing Prices
    • Mortgage Rates
    • NYSE Index
    • Inf. Indexed Bonds
    • Movie Revenues
    • Inflation-Adjusted Wages
  • Cost of Living
    • Calculate Cost of Living
    • Cost-of-living Adj. (COLA)
    • Consumer Price Index CPI
      • Historical CPI
      • Current CPI
      • CPI Release Dates
    • Gas Prices >
      • Cost of Gas
      • Cost of Gas Per Month
      • Gas vs. Oil Price Chart
    • Food Prices 1913 vs 2013
    • Health Insurance
  • Blog
    • Key Inflation Articles
    • International Inflation
    • Historical Inflation Rates for Japan (1971 to 2014)
You are here: Home » PPI

November Producer Price Index Declines from 2021 to 2022

Published on December 9, 2022 by Tim McMahon 2 Comments

PPI Nov 2022

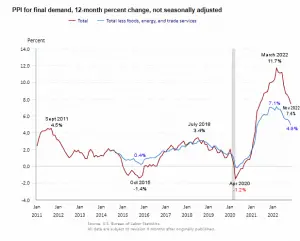
Typically when we think of inflation, we look at the Consumer Price Index (CPI), which measures prices affecting Consumers. Today we are going to look at the November Producer Price index. According to the U.S. Bureau of Labor Statistics (BLS), "the Producer Price Index (PPI) measures the average change over time in the prices domestic producers receive for their output. It is a measure of inflation at the wholesale level that is compiled from thousands of indexes measuring producer prices by industry and product category." The index is published monthly, but unlike the CPI, the PPI is subject to adjusting/correcting over the following four months after publication. The CPI is considered … [Read more...]

Filed Under: Inflation Tagged With: Final, Intermediate, PPI, Producer Prices

The 3 Stages of Inflation

Published on June 3, 2021 Updated on August 20, 2021 by Tim McMahon Leave a Comment

Raw Material Index

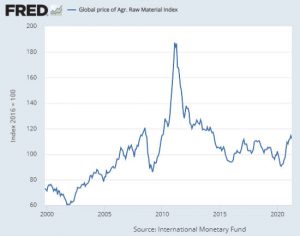
Inflation tends to arrive in 3 stages: Stage 1 The first stage is the price manufacturers pay for their raw materials. This can be tracked in a variety of ways including the Global Price of Agrigated Raw Materials published by the St. Louis Federal Reserve. Interestingly, raw materials prices peaked in February 2011 at 187.2 and then fell steadily over the next 4 years. Prices stabilized for a few years before plummeting due to COVID. Since then raw materials prices have spiked sharply. But are still nowhere near 2011 levels. One of the reasons for the sharp spike in 2011 was serious flooding causing massive crop loss driving the price of four basic crops (wheat, rice, corn, and soybeans) … [Read more...]

Filed Under: Inflation Tagged With: CPI, inflation, PPI, Producer Prices, Raw Materials

How Does Inflation Affect Businesses?

Published on September 28, 2019 by Tim McMahon Leave a Comment

The fallout from inflation doesn’t always receive a balanced, informed portrayal from the media. This is somewhat understandable since, unless inflation makes a drastic move, its slow steady erosion of purchasing power is not considered newsworthy. However, as with most economic forces, not everyone “loses” when inflation boosts the everyday cost of living. Inflation can actually either benefit or destroy American businesses, and individual preparation for its eventual, inevitable impact often decides how detrimental or beneficial it is. Foreign Exchange International purchases become more costly as inflation diminishes the dollar’s purchasing power relative to other currencies. This … [Read more...]

Filed Under: Inflation Tagged With: Business, inflation, PPI, Producer Prices

Deflation Not Over?

Published on March 1, 2013 Updated on February 17, 2014 by Elliott Wave International Leave a Comment

The majority of the inflation from 2012 occurred in the first quarter with extremely high monthly rates of inflation.  Overall in 2012 there were 6 very inflationary months (on a monthly basis), 5 slightly deflationary months and 1 very deflationary month (November).  The first month of 2013 started out pretty inflationary but the first quarter of the year generally shows the most inflation for the entire year. See Table … [Read more...]

Filed Under: Deflation Tagged With: defltio, PPI, Producer Price Index

Producer Price Index (PPI) and Consumer Sentiment Index Point to Deflation

Published on December 19, 2012 Updated on February 17, 2014 by Elliott Wave International Leave a Comment

Producer Price Index

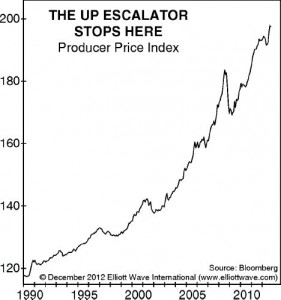
Two Signs That Deflation is Far From Over Producer Price Index (PPI) turns south The federal government defines the Producer Price Index (PPI) as "the average change over time in the selling prices received by domestic producers for their output." With help from the Federal Reserve's massive inflationary policies, the PPI has climbed even as the economy began to fall in 2008-09. All the while, the financial media persisted with stories of an economic recovery. EWI analysts offer an independent perspective. The New York Times declares, "Economic Gloom Starting to Lift." Corporate America, however, is not so sure. This chart of producer prices [wave labels removed] probably … [Read more...]

Filed Under: Deflation Tagged With: Consumer Sentiment Index, PPI, Producer Price Index

Latest Posts

  • Inflation Down In January 2026
  • BLS Inflation Data Delayed
  • Updated Cumulative Inflation Calculator
  • Inflation-Adjusted Silver Prices
  • December Inflation Down Slightly, Not Flat
  • December 2025 Inflation Report for November
  • How Deflation Created the Middle Class
  • October Inflation Numbers Delayed

Sponsored:

As a Seasoned Investor I thought I'd seen everything... But recently I discovered TradingView which has really improved the information I have at my fingertips.~ Tim McMahon, editor

TradingView gives me an edge... including powerful charting tools, real-time market data, and a global community of traders—all in one easy to use platform. It has hundreds of indicators, and even custom scripts for more advanced users, and you don't need to change Brokers just use its seamless brokerage integration... TradingView isn't just a charting tool—it's your full trading command center.

Trade smarter. Trade faster. Check Out TradingView for free.

----------

The Best Place to Buy Your Crypto

Coinbase is the largest Crypto Trading platform in the U.S. and the easiest to use. ~Tim McMahon, editor

Check out Coinbase here

Subscribe Now

eTrends Signup Form

Elliott Wave Resources

Free Elliott Wave Resources

What is Waveopedia?

Waveopedia is EWI’s free, comprehensive index of Elliott wave patterns and terms. Everyone from beginners to experts can benefit from it. It’s a great place to send your followers if they’re new to Elliott waves.

  • Deflation Hits China is the U.S. Next?

  • Why You Must Avoid the Herding Trap

  • Chasing Trends Can Cost You

  • More Education Resources

Post Archives

Home | Articles | Sitemap | Terms of Service | Privacy | Disclaimer | Advertise With Us

Copyright © 1996-2026 · Capital Professional Services, LLC · Maintained by Design Synergy Studio · Admin

Do Not Sell My Personal Information