
Inflation Summary:
- Annual Inflation up sharply to 5.39%
- CPI Index rose from 269.195 in May to 271.696 in June.
- Monthly Inflation for March 0.71%, April 0.82%, May 0.80%, and June was 0.93% .
- Next release August 11th
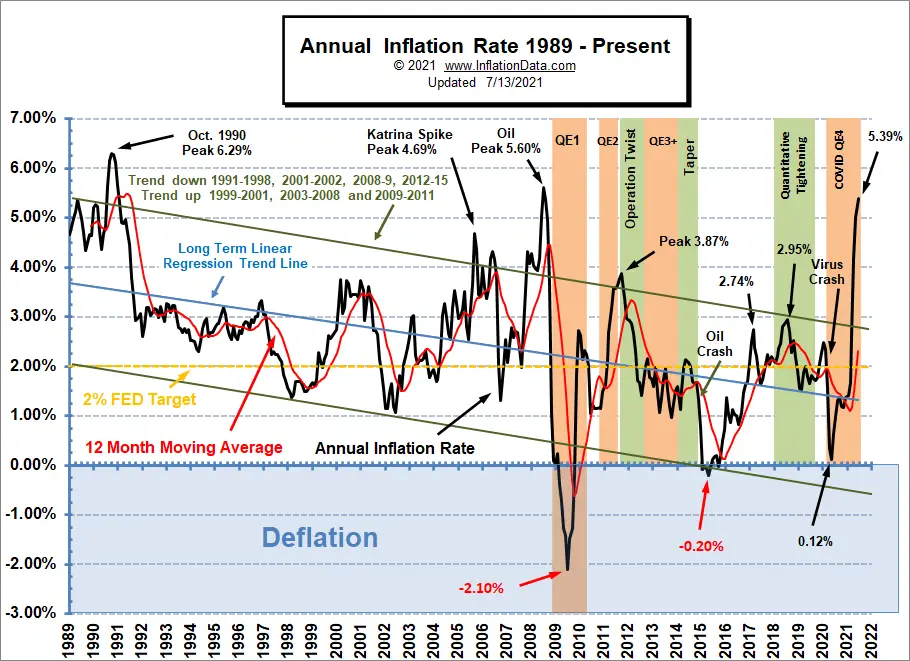
Inflation for the 12 months ending in June was 5.39% for the Largest Annual Increase since July 2008’s 5.60%
Last month’s 4.99% was the largest increase since August 2008’s 5.37% but at 5.39% June 2021 was actually slightly higher than that. (Although the BLS reported them both as 5.4%). If inflation tops the 5.6% of July 2008, we have to go all the way back to the 6.29% of October 1990 to find a higher peak.
We have been predicting Annual Inflation would shoot up since September 2020, due to negative monthly numbers falling out of the annual calculation. But in addition, we have seen VERY high monthly numbers spiking inflation even higher than we expected. At 0.80% May’s monthly inflation was very high but then June was even higher. This is especially troubling because typically, inflation moderates starting in June but like June 2008, that didn’t happen this year. So adding 0.93% in June spiked Annual Inflation from 4.99% to 5.39%. Another month like the last 4 and inflation will exceed the 5.6% of 2008.
BLS Commissioner’s Inflation Report:
According to the BLS commissioner’s report, “The Consumer Price Index for All Urban Consumers (CPI-U) increased 0.9 percent in June on a seasonally adjusted basis after rising 0.6 percent in May, the U.S. Bureau of Labor Statistics reported today. This was the largest 1-month change since June 2008 when the index rose 1.0 percent. Over the last 12 months, the all items index increased 5.4 percent before seasonal adjustment; this was the largest 12-month increase since a 5.4-percent increase for the period ending August 2008..”
(But actually, this month’s Annual inflation was 5.39% and August 2008 was 5.37% so we have to go back to July 2008’s 5.60% to find higher annual inflation.)
For more information see the price changes in various components of the Consumer Price Index over the last 20 years.
Seasonally Adjusted Inflation Components Table
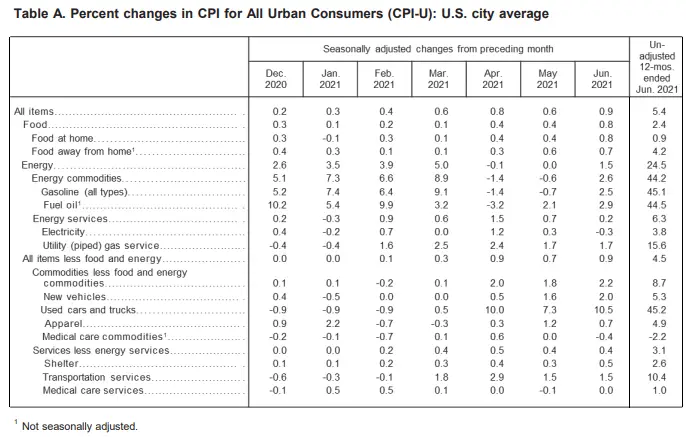 As we can see from the table above Energy and Used Vehicles were the biggest gainers at 24.5% and 45.2% respectively.
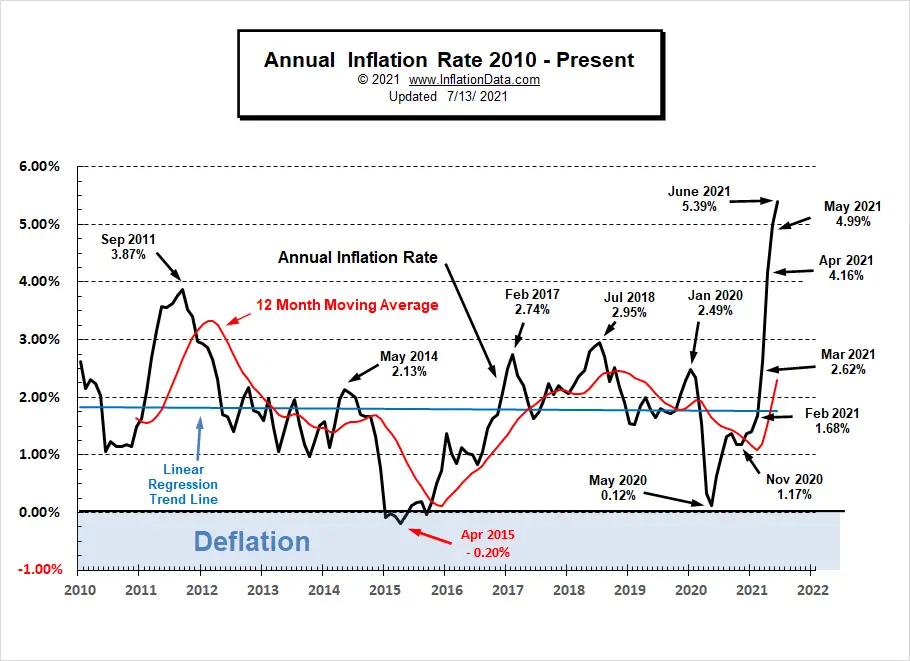
Current Inflation Situation
Looking at just the most recent years since 2010, we can easily see the current levels are more than 1% higher than September 2011.
 Moore Inflation Predictor (MIP)
Way back in September 2020 we started projecting massive increases for 2021 and up until recently, that projection was right on track. But even we didn’t see the massive spike that has happened in the last two months.
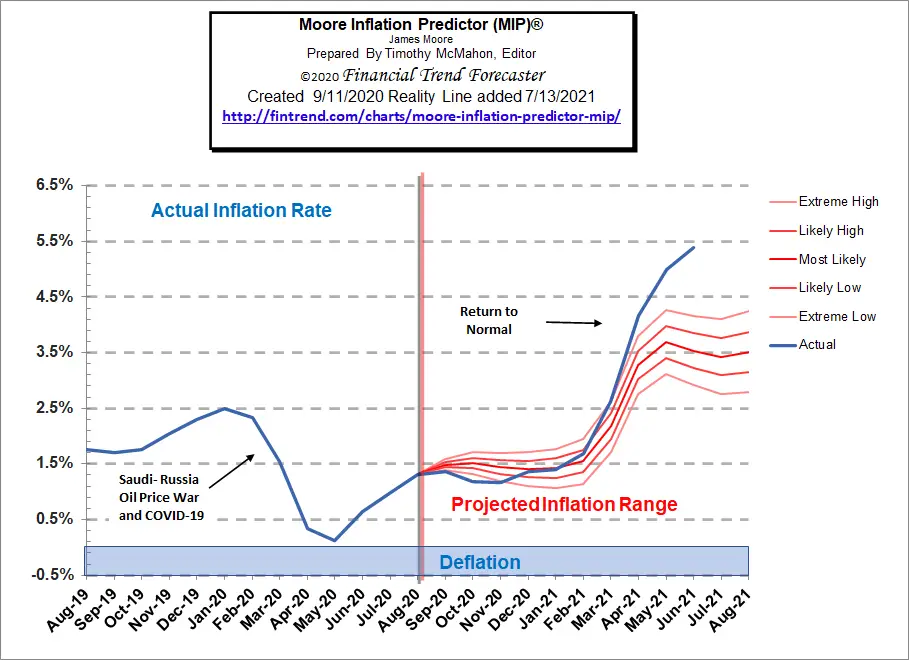
See: Moore Inflation Predictor for current info.
Not Seasonally Adjusted Monthly Inflation Rates
We can see from the table below that every month so far in 2021 is higher than the corresponding month in either 2019 or 2020.
| Jan | Feb | Mar | Apr | May | Jun | Jul | Aug | Sep | Oct | Nov | Dec | |
| 2016 | 0.17% | 0.08% | 0.43% | 0.47% | 0.41% | 0.33% | (0.16%) | 0.09% | 0.24% | 0.12% | (0.16%) | 0.03% |
| 2017 | 0.58% | 0.31% | 0.08% | 0.30% | 0.09% | 0.09% | (0.07%) | 0.30% | 0.53% | (0.06%) | 0.002% | (0.06%) |
| 2018 | 0.54% | 0.45% | 0.23% | 0.40% | 0.42% | 0.16% | 0.01% | 0.06% | 0.12% | 0.18% | (0.33%) | (0.32%) |
| 2019 | 0.19% | 0.42% | 0.56% | 0.53% | 0.21% | 0.02% | 0.17% | (0.01%) | 0.08% | 0.23% | (0.05%) | (0.09%) |
| 2020 | 0.39% | 0.27% | (0.22%) | (0.67%) | 0.002% | 0.55% | 0.51% | 0.32% | 0.14% | 0.04% | (0.06%) | 0.09% |
| 2021 | 0.43% | 0.55% | 0.71% | 0.82% | 0.80% | 0.93% |
See: Monthly Inflation Rate for more information and a complete table of Unadjusted Monthly Rates.
For more information See Annual Inflation.
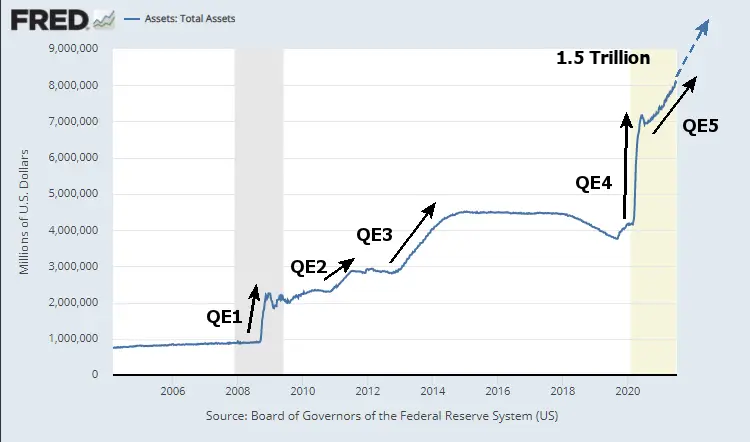
Federal Reserve Actions
If you think this inflation is bad just wait until the FED pumps in another 1.5 Trillion into the economy. See NYSE ROC for more info.
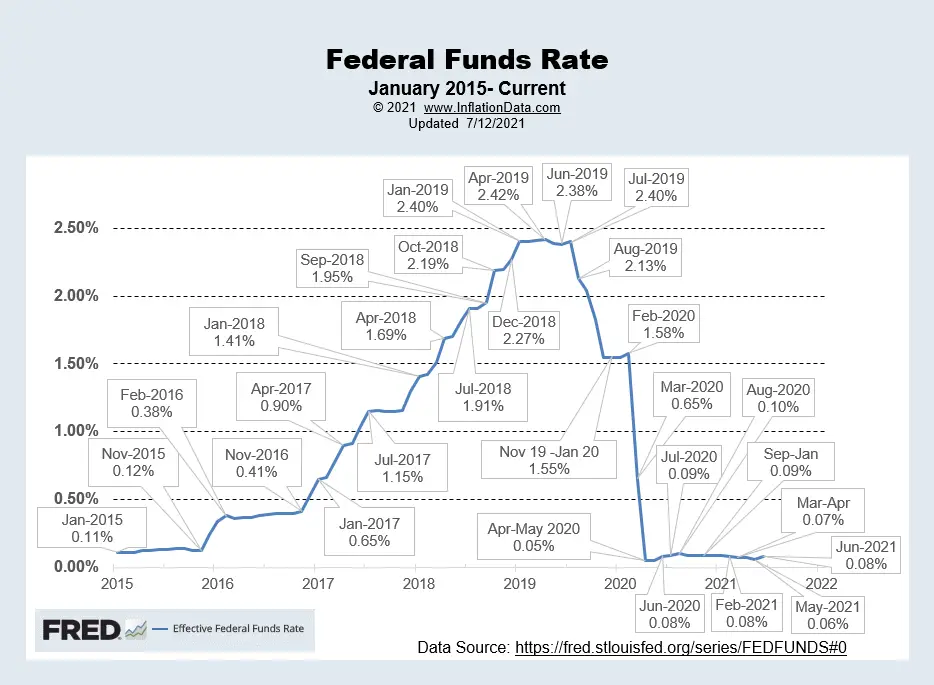
FED Funds Rate
The FED did raise the FED funds rate a measly 2 hundredths of a percent from May to June, which is obviously more symbolic than practical.
Chart Source St Louis FED.
For more info See NYSE ROC and MIP.
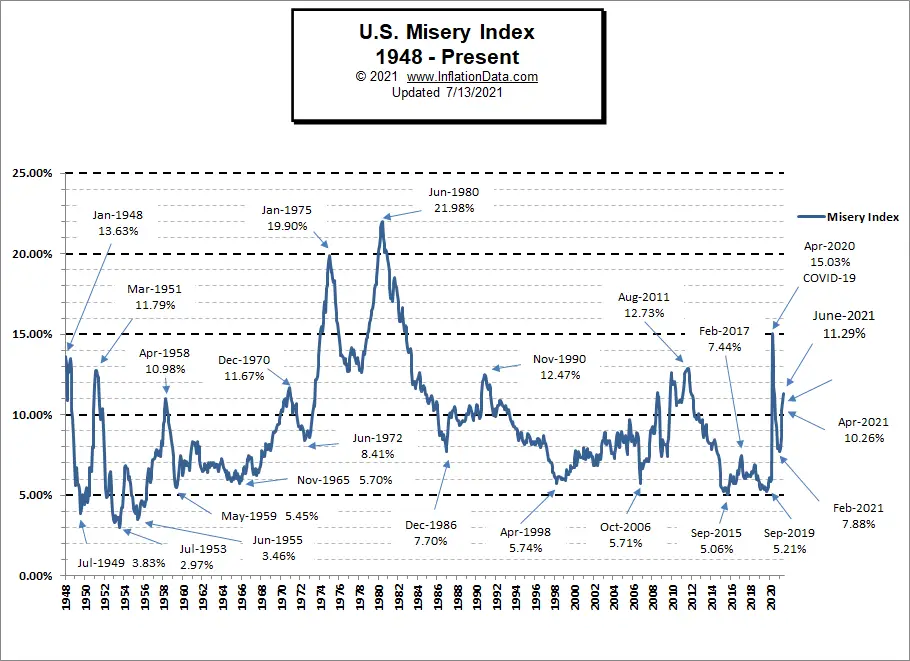
Misery Index
The misery index spiked along with the inflation rate.
[Read More…]
NYSE Rate of Change (ROC)©

Hold? Signal (Whipsaw)
This month’s NYSE ROC chart shows a rise despite the index itself being basically flat.
See the NYSE ROC for more info.
NASDAQ Rate of Change (ROC)©

Hold Signal????
The NASDAQ ROC on the other hand was flat despite the index being up almost 5%.
See NASDAQ ROC for more.
Regional Inflation Information
The U.S. Bureau of Labor Statistics also produces regional data. So if you are interested in more localized inflation information you can find it here.
| AL | AK | AR | AZ | CA | CT | CO | DC | DE | FL | GA | GU | HI | IA |
| ID | IL | IN | KS | KY | LA | MA | MD | ME | MI | MN | MO | MS | MT |
| NC | ND | NE | NH | NJ | NM | NV | NY | OH | OK | OR | PA | PR | RI |
| SC | SC | SD | TX | UT | VA | VI | VT | WI | WA | WI | WV |
You Might Also Like:
From InflationData.com
- Oil vs. Gold- Why Compare Commodity Prices Against Each Other?
- How Does a Country “Export” its Inflation?
- May’s Annual Inflation Soars to ~5%
- Comparing Oil vs. Gold (updated)
From UnemploymentData.com.
- Creating a Personal Brand for Your Success
- June Employment and Unemployment Both Up
- Accountant vs Bookkeeper: What Do They Do for a Small Business?
- How to Make Yourself More Employable
- 4 Major Costs of Workplace Injuries to Include in Your Claim
From Financial Trend Forecaster
- The Making of the Next Housing Crisis
- Which is Over Priced? Oil or Gold?
- What are NFTs and Why are They Going Crazy?
- Is Bitcoin Headed For a Fall?
- Blockchain Goes to Ethiopia
- Online Stockbrokers Going Public
From Elliott Wave University
- High “Beta” stocks … “Meme” stocks… and Index stocks… Oh My!
- Why U.S. Corporate Bankruptcies Could Skyrocket
- Why “Trouble is Brewing” for the U.S. Housing Market
- The Fear of Missing Out
From OptioMoney.com (New Look)
- Tips For Renting Out a Room In Your House
- How to Prepare to Apply for a Mortgage When You Are Self-Employed
- How to Minimize Complications When Reducing Your Mortgage
- How Much Value Does An Extra Bedroom Add To A House?
From Your Family Finances
- How to Help Your Children Afford Their First Home
- Planning Financially for Your Retirement
- Make Your Mortgage More Affordable After Retirement
- A Beginner’s Guide to Managing Your Money
- 7 Essential Money Lessons to Teach Your Kids

Leave a Reply