
On September 14th, 2021, the Bureau of Labor Statistics said that in August 2021, the Annual Inflation Rate was down.
Inflation Summary:
- Annual Inflation was 5.25% in August, 5.37% in July, and 5.39% in June.
- CPI Index rose from 273.003 in July to 273.567 in August.
- Monthly Inflation for July was 0.48% and 0.21% for August.
- Next release October 13th
Inflation for the 12 months ending in August was down 0.12% from July.
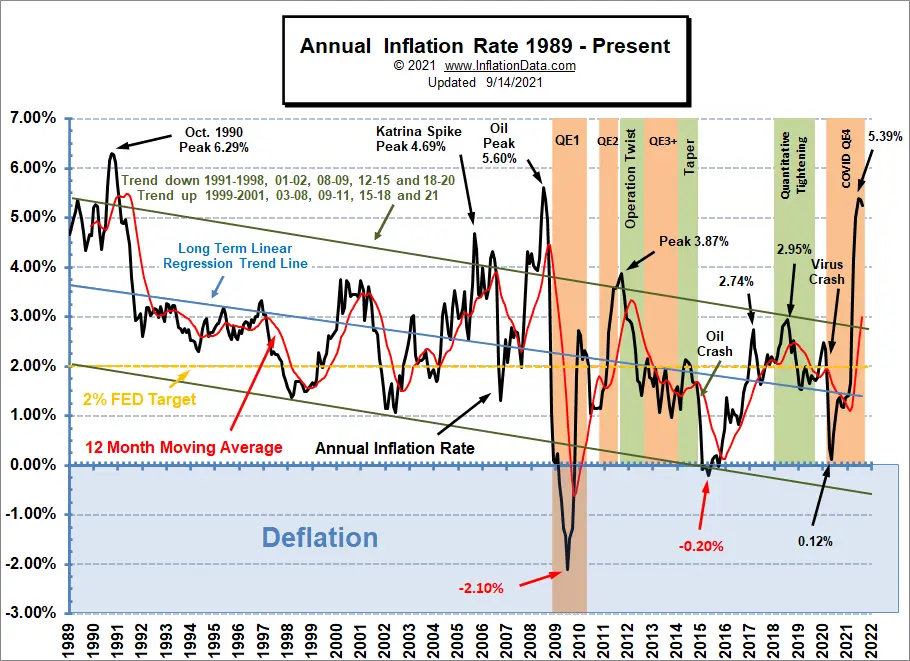
Since the BLS rounds to 1 decimal place, they reported June and July as 5.4% and August as 5.3%. The last time inflation was this high was the 5.6% of July 2008. Prior to that, we have to go all the way back to the 6.29% of October 1990 to find a higher peak.
BLS Commissioner’s Inflation Report:
According to the BLS commissioner’s report, “The Consumer Price Index for All Urban Consumers (CPI-U) increased 0.3 percent in August on a seasonally adjusted basis after rising 0.5 percent in July, the U.S. Bureau of Labor Statistics reported today. Over the last 12 months, the all items index increased 5.3 percent before seasonal adjustment. The indexes for gasoline, household furnishings and operations, food, and shelter all rose in August and contributed to the monthly all items seasonally adjusted increase. The energy index increased 2.0 percent, mainly due to a 2.8-percent increase in the gasoline index. The index for food rose 0.4 percent, with the indexes for food at home and food away from home both increasing 0.4 percent.”
But since we calculate it to two decimal places, August 2021 Annual Inflation was 5.25%, down from 5.37% in July. Rather than the BLS’s 5.3% and 5.4%.
For an interesting look at prices and wages, see the price changes in various components of the Consumer Price Index over the last 20 years.
Seasonally Adjusted Inflation Components Table
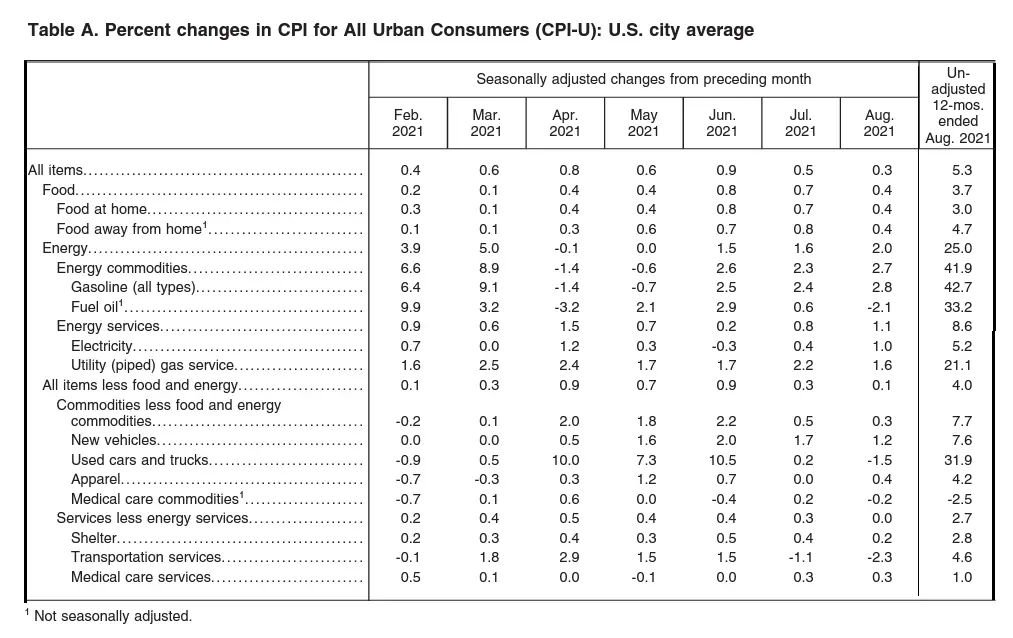
Click Table for a larger image
When we measure Inflation to two decimals (on a non-adjusted basis), monthly inflation was 0.21% in August, 0.48% in July, 0.93% in June, 0.80% in May. Key components are the increase in Gasoline prices, which increased 42.7% over the last year and is up 2.8% over the last month. Used Cars and Trucks were also up 31.9% over year-ago prices. Food was up 3.7% over year-ago prices.
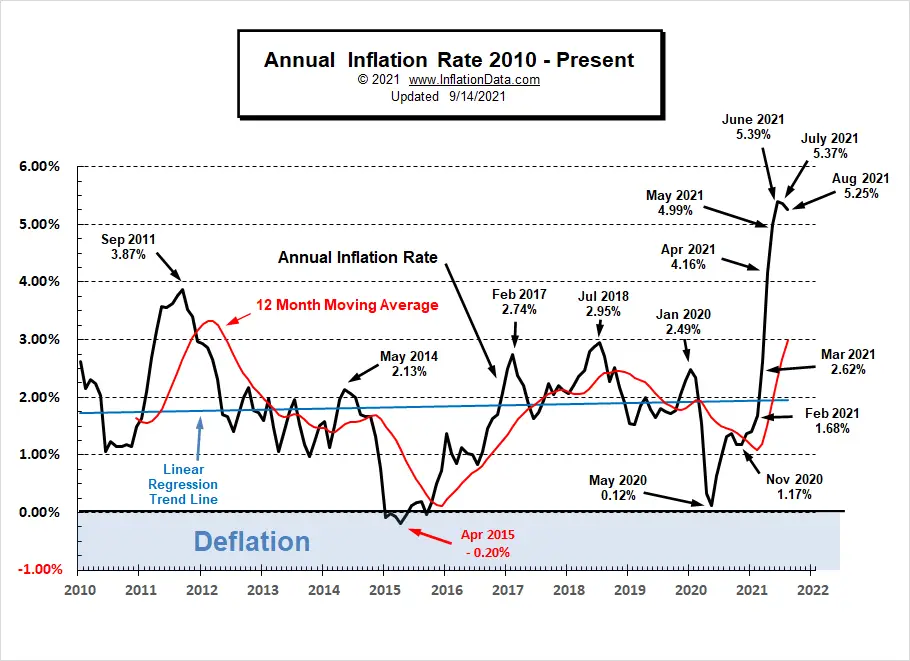
August 2021 Inflation Situation
The downtrend on the chart since 2010 no longer exists!
Up until this month, the linear regression line was still tilted slightly downward. But the current upward spike has started to drag it upward. So looking only at this chart it is hard to believe that the long-term trend was down. Which could indicate the beginning of a different trend and that April 2015 was the bottom. Looking at the longer-term chart above, we would see that deflation was lower in 2009, which could be the actual turning point, shifting the downtrend into an uptrend.
The other notable feature of this chart is the possible peak in June since we have now had 2 months come in lower (albeit only very slightly).
 See Annual Inflation for more information.
Moore Inflation Predictor
It’s hard to imagine now, but the annual inflation rate for the 12 months through the end of February was only 1.68%. And a year ago, May 2020’s low was 0.12%. Now, we are well above 5%, which is typically when the public starts getting concerned about inflation.
For the last several months, we have included a higher than typical projection called “if the FED is wrong” and it has (if anything) been too low. But last month’s projection fell exactly on the median “most likely” line. This could indicate that the FED’s pronouncement that inflation is transitory could be possible, only time will tell.
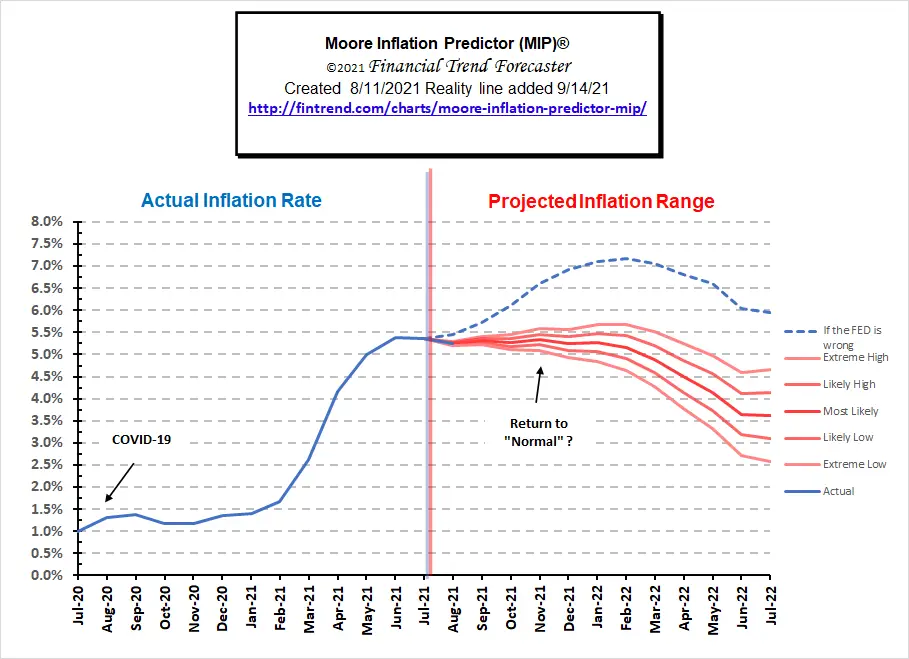
See our Moore Inflation Predictor for this month’s projection.
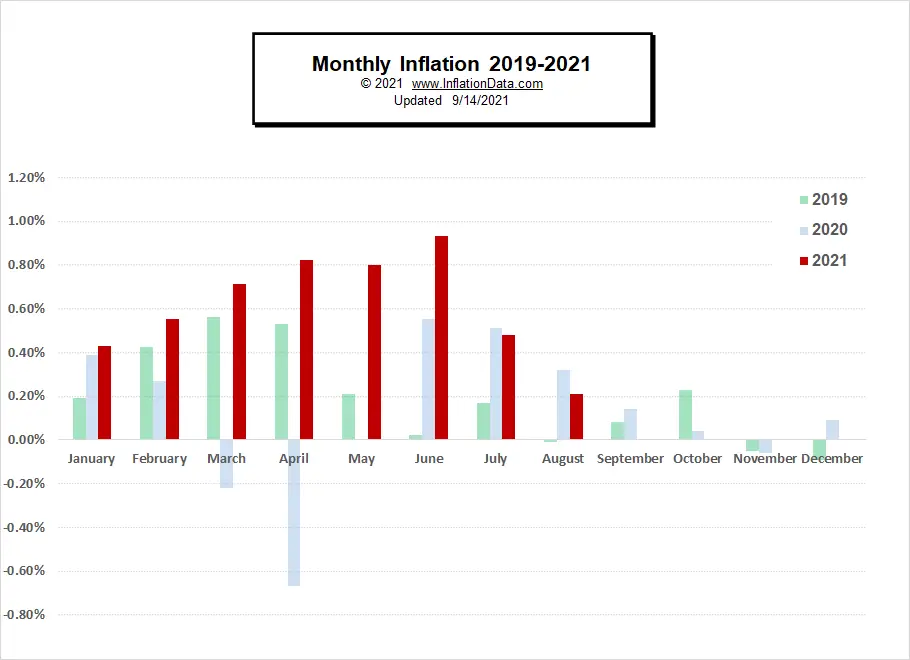
Not Seasonally Adjusted Monthly Inflation Rates
We can see from the table below that every month through June of 2021 is higher than the corresponding month in either 2019 or 2020. But July and August were slightly lower than in 2020.
| Jan | Feb | Mar | Apr | May | Jun | Jul | Aug | Sep | Oct | Nov | Dec | |
| 2016 | 0.17% | 0.08% | 0.43% | 0.47% | 0.41% | 0.33% | (0.16%) | 0.09% | 0.24% | 0.12% | (0.16%) | 0.03% |
| 2017 | 0.58% | 0.31% | 0.08% | 0.30% | 0.09% | 0.09% | (0.07%) | 0.30% | 0.53% | (0.06%) | 0.002% | (0.06%) |
| 2018 | 0.54% | 0.45% | 0.23% | 0.40% | 0.42% | 0.16% | 0.01% | 0.06% | 0.12% | 0.18% | (0.33%) | (0.32%) |
| 2019 | 0.19% | 0.42% | 0.56% | 0.53% | 0.21% | 0.02% | 0.17% | (0.01%) | 0.08% | 0.23% | (0.05%) | (0.09%) |
| 2020 | 0.39% | 0.27% | (0.22%) | (0.67%) | 0.002% | 0.55% | 0.51% | 0.32% | 0.14% | 0.04% | (0.06%) | 0.09% |
| 2021 | 0.43% | 0.55% | 0.71% | 0.82% | 0.80% | 0.93% | 0.48% | 0.21 |
See: Monthly Inflation Rate for more information and a complete table of Unadjusted Monthly Rates.
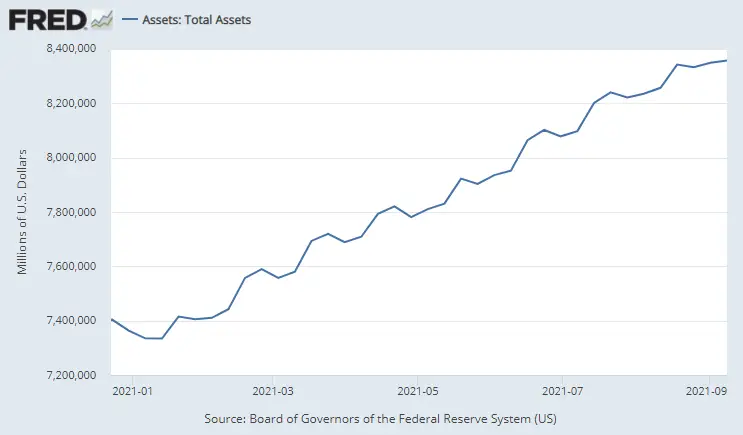
Federal Reserve Actions
It looks like the FED has reigned in their money creation activities over the last month.
FED Funds Rate
But in a twist of logic, rather than raising interest rates to fight inflation, they actually lowered them. Although, it was probably more symbolic than effective since they really don’t have much room to go lower.
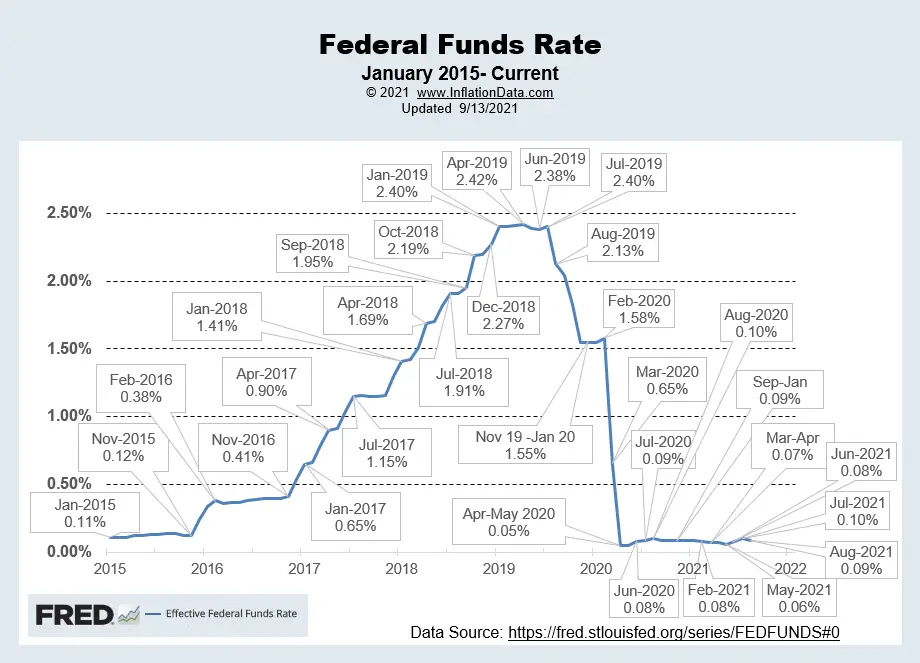 Chart Source St Louis FED.
For more info, See NYSE ROC and MIP.
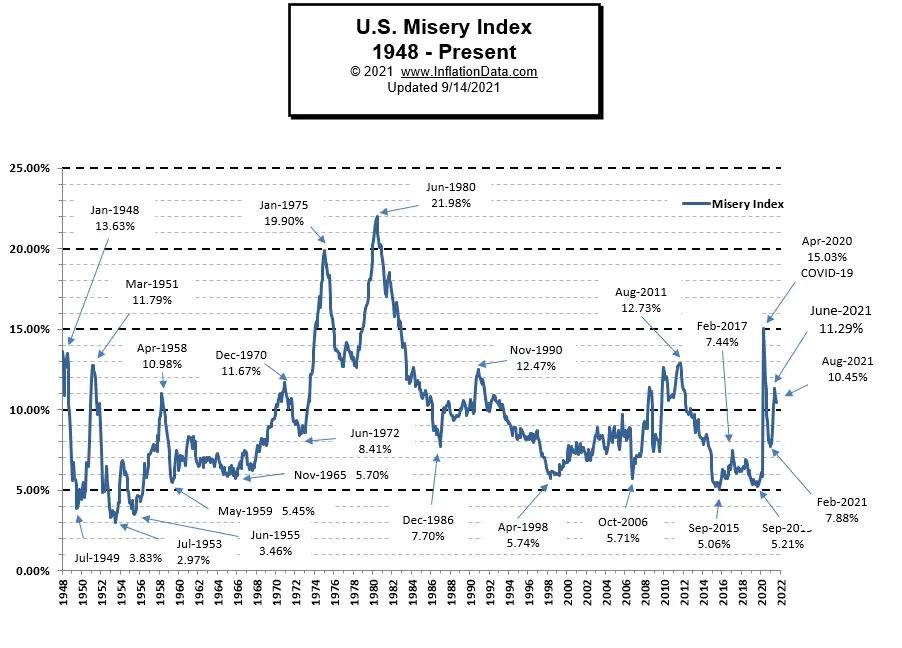
Misery Index
The misery index fell along with the inflation rate and unemployment.
[Read More…]
NYSE Rate of Change (ROC)©

Hold? Signal (Whipsaw)
The NYSE ROC index is down but still above its moving average.
See the NYSE ROC for more info.
NASDAQ Rate of Change (ROC)©

Sell Signal????
The NASDAQ ROC, on the other hand, has fallen below its moving average generating a tentative Sell signal unless the NASDAQ spikes up in the next couple of months.
See NASDAQ ROC for more.
Regional Inflation Information
The U.S. Bureau of Labor Statistics also produces regional data. So if you are interested in more localized inflation information you can find it here.
| AL | AK | AR | AZ | CA | CT | CO | DC | DE | FL | GA | GU | HI | IA |
| ID | IL | IN | KS | KY | LA | MA | MD | ME | MI | MN | MO | MS | MT |
| NC | ND | NE | NH | NJ | NM | NV | NY | OH | OK | OR | PA | PR | RI |
| SC | SC | SD | TX | UT | VA | VI | VT | WI | WA | WI | WV |
You Might Also Like:
From InflationData.com
- How to Prepare for Inflation
- Safe-Haven Investments that Protect Your Capital From Rising Inflation
- 9 Inflation Books You Must Read
- Hyperinflation Strikes Lebanon… Again
From UnemploymentData.com.
- 6 Reasons to Know Your Rights as an Employee
- New Careers in Workforce Management
- What To Do If an Injury is Keeping You From Working
- Ingenious Ways To Make Money Online
- August Unemployment Improves as Pandemic Benefits Expire
From Financial Trend Forecaster
- Farming: Discovering New Ways to Feed the Planet
- Fintech: The New Financial Management Disruptive Technology
- Record Credit Card Debt Reduction
- The Making of the Next Housing Crisis
- Which is Over Priced? Oil or Gold?
- What are NFTs and Why are They Going Crazy?
From Elliott Wave University
- “Kiss of Death” Stock Market Indicator
- Will Oil Prices Skyrocket in the Aftermath of Hurricane Ida?
- Be Prepared “Or Else”
- The Maniacal Residential Real Estate Market
- Why the Stock Market is the True “Great Deceiver”
From OptioMoney.com (New Look)
- Secrets for Lucrative Investment Properties
- How to Get the Most Money When You Sell Used Furniture
- A Unique Way to Create Extra Income
- How Your Credit Score Affects You and Your Family
- Tips For Renting Out a Room In Your House
From Your Family Finances (New Look)
- How Making Small Car Repairs Can Save You Money in the Future
- How to Avoid Retirement Savings Mistakes
- How to Manage Your Wealth During Difficult Financial Times
- Home Renovation Mistakes to Avoid at All Costs
- Budget Monthly Expenses the Easy Way

Leave a Reply