
Inflation Summary:
- Annual Inflation up from 1.36% in December to 1.40% in January.
- CPI Index rose slightly from 260.474 in December to 261.582 in January.
- Monthly Inflation for December was 0.09%, January was 0.43%.
- Next release March 10th
Annual inflation for the 12 months ending in January was 1.40%
The CPI index itself was up from 260.474 in December to 261.582 in January. Resulting in a monthly inflation rate of 0.43%.
Annual inflation for the 12 months ending in December was 1.36%, the 12 months ending in January was 1.40%.
Since the BLS rounds their numbers they report both as 1.4%.
Setting the Stage for Inflation
Due to the Corona Virus, March and April 2020 were -0.22% and -0.67% respectively, resulting in a massive disinflationary environment. When these numbers fall out of the Annual inflation equation in 2021 we can expect a massive jump in the annual inflation rate. If for instance March 2021 comes in at 0.28% that would take the annual inflation rate up to 1.9% (without any rise in February). If however, March is a more normal 0.5% we could see inflation well over 2% in March. And April could easily see inflation jump another 1%. Even if we see Zero monthly inflation in March and April 2021 the Annual inflation rate will jump up 0.89% (almost 1%) since those negative numbers will no longer be pulling the average down. See MIP for more information.
BLS Commissioner’s Inflation Report:
“The Consumer Price Index for All Urban Consumers (CPI-U) increased 0.3 percent in January on a seasonally adjusted basis, the U.S. Bureau of Labor Statistics reported today. Over the last 12 months, the all items index increased 1.4 percent before seasonal adjustment. The gasoline index continued to increase, rising 7.4 percent in January and accounting for most of the seasonally adjusted increase in the all items index. Although the indexes for electricity and natural gas declined, the energy index rose 3.5 percent over the month. The food index rose slightly in January, increasing 0.1 percent as an advance in the index for food away from home more than offset a decline in the index for food at home. “
When we measure it to two decimals (on a non-adjusted basis) monthly inflation was 0.43% in January and annual inflation was 1.40%. Key components are the increase in Food prices which increased 3.8% over the last year (much higher than the average of all items). Used cars increased 10% the major factor that held prices down was Energy but that has been ticking up in the last couple of months. For more information see the price changes in various components of the Consumer Price Index over the last 20 years.
Seasonally Adjusted Inflation Components Table
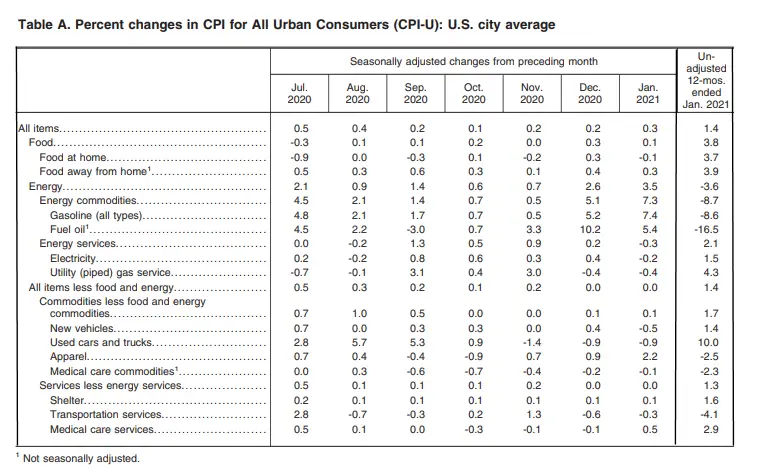
From the table above we can see that overall the Energy category was down -3.6% on an annual basis but up 3.5% on a seasonally adjusted monthly basis (January) on top of 2.6% increase for December. Fuel Oil was down -16.5% for the year. Used cars, on the other hand, were up 10.0%. Food was up 3.6%, Medical Care Services were up 2.9%, and apparel was down -2.5%. So we can see that not all products experience the same rate of changes in their prices.
Annual Inflation Chart:
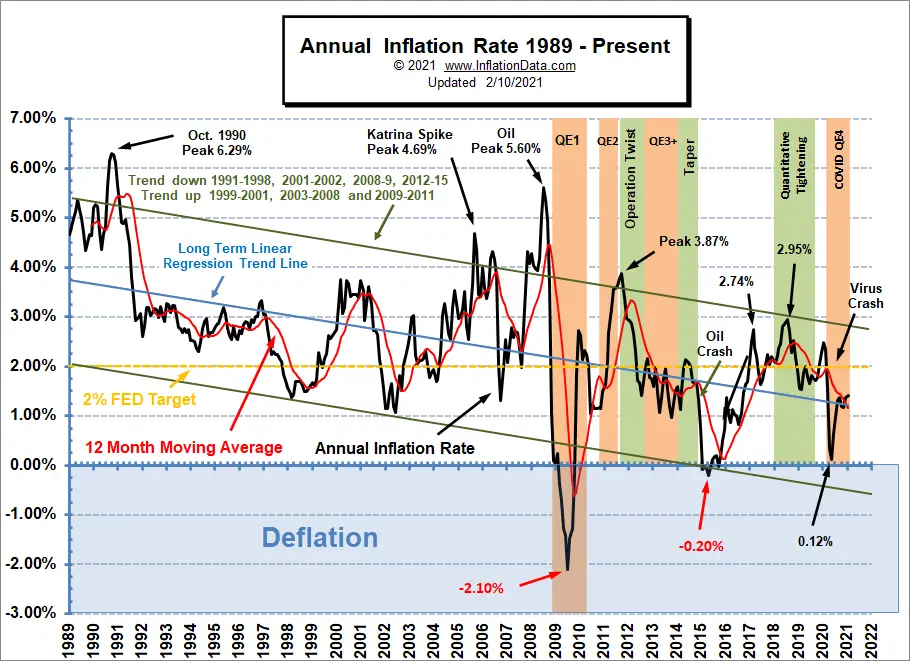
Annual inflation ticked up slightly and remains above its moving average and the linear regression line. Inflation may be starting to make a comeback even though it is currently still below the FED’s 2% target. We can also see that the long term trend is still down from the October 1990 peak.
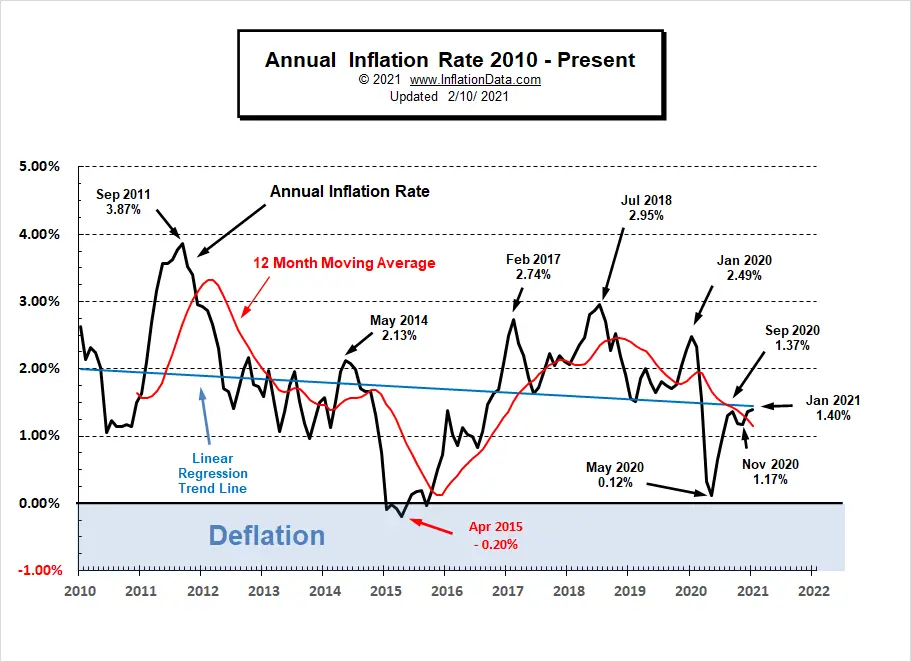
Current Inflation Situation
Looking at just the most recent 10 years the trend is less obvious. Inflation peaked in September 2011 at 3.87% and again in July 2018 at 2.95% and bottomed at -0.20% in April 2015 and at 0.12% in May of 2020. With the Linear Regression Line still tilted slightly downward we can see the trend is still down.
Moore Inflation Predictor (MIP)
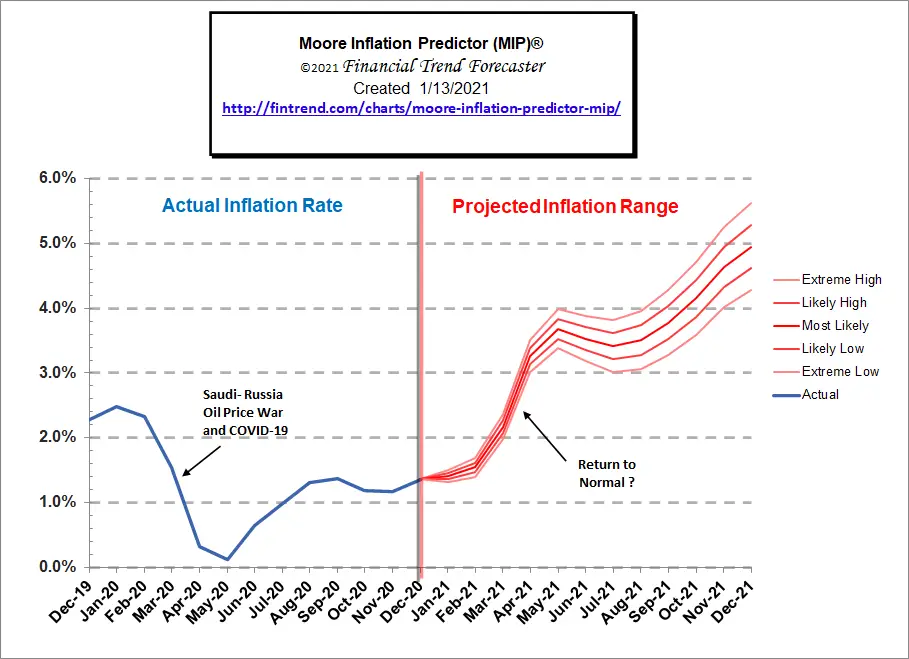
The monthly inflation rate for January was 0.43%, which is pretty typical for January through May. December was 0.09% which sounds low but considering the 4th quarter is typically negative anything positive is actually high.
Typically the majority of the inflation occurs in the first 5 months of the year and then the summer months are moderate and the Fall months are low to negative (i.e. deflationary) but 2020 turned everything upside down with March and April being massively deflationary and the summer months being inflationary. The 4th quarter was pretty typical but not as deflationary as it could have been.
Back in September we created this chart projecting a massive spike coming in March and April. So far this projection has been pretty close with December and January tracking almost exactly on the “most likely” line.
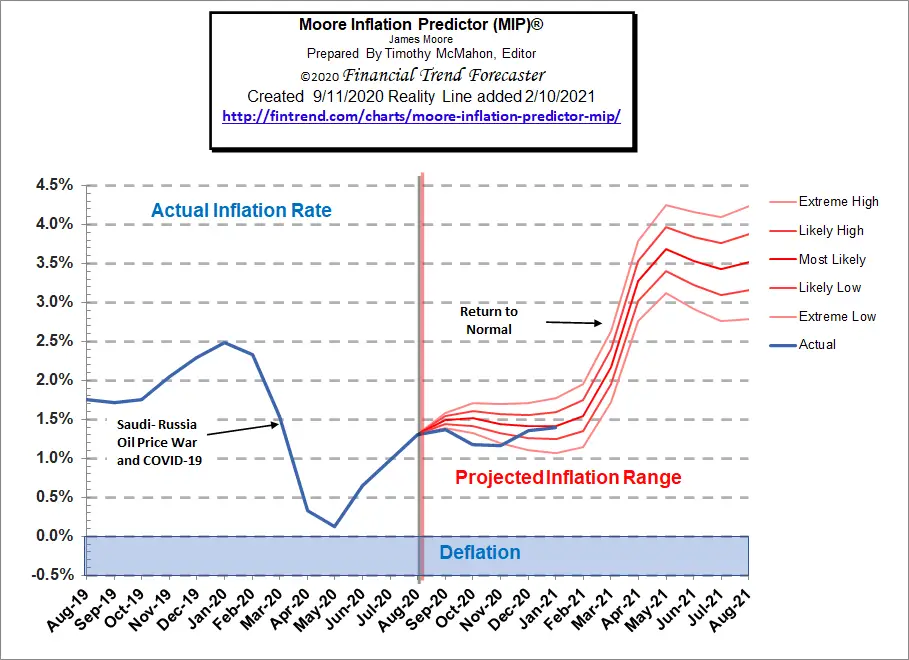
See: Moore Inflation Predictor for current info
Not Seasonally Adjusted Monthly Inflation Rates
Monthly inflation for June was 0.55% comprising the majority of the annual inflation since March and April’s deflation canceled out much of the rest of the year’s inflation.
| Jan | Feb | Mar | Apr | May | Jun | Jul | Aug | Sep | Oct | Nov | Dec | |
| 2016 | 0.17% | 0.08% | 0.43% | 0.47% | 0.41% | 0.33% | (0.16%) | 0.09% | 0.24% | 0.12% | (0.16%) | 0.03% |
| 2017 | 0.58% | 0.31% | 0.08% | 0.30% | 0.09% | 0.09% | (0.07%) | 0.30% | 0.53% | (0.06%) | 0.002% | (0.06%) |
| 2018 | 0.54% | 0.45% | 0.23% | 0.40% | 0.42% | 0.16% | 0.01% | 0.06% | 0.12% | 0.18% | (0.33%) | (0.32%) |
| 2019 | 0.19% | 0.42% | 0.56% | 0.53% | 0.21% | 0.02% | 0.17% | (0.01%) | 0.08% | 0.23% | (0.05%) | (0.09%) |
| 2020 | 0.39% | 0.27% | (0.22%) | (0.67%) | 0.002% | 0.55% | 0.51% | 0.32% | 0.14% | 0.04% | (0.06%) | 0.09% |
| 2021 | 0.43% |
See: Monthly Inflation Rate for more information and a complete table of Unadjusted Monthly Rates.
For more information See Annual Inflation.
Federal Reserve Actions
According to the National Bureau of Economic Research (NBER) the U.S. has been in a recession since February (shaded area) after the longest boom in economic history. According to NBER the peak occurred in February 2020. Often their peaks will take a long time before people realize that things are not going well. It is, however, possible that the “recession” will be short-lived if the economy can get back on track especially in light of all the FED money pumping going on.
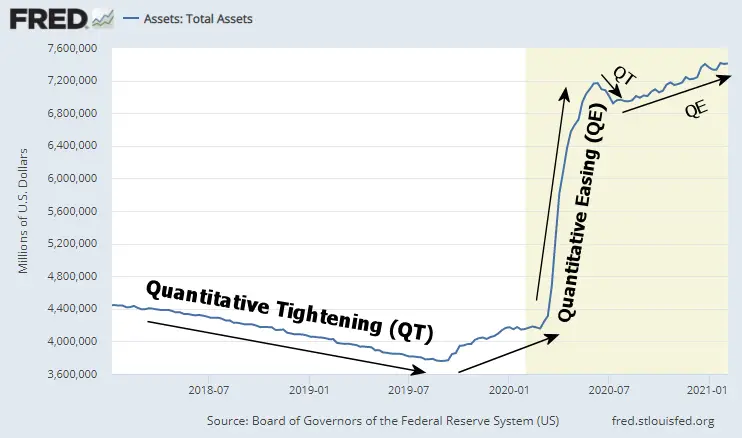
In the following chart, we see the Federal Reserve Total Assets have gradually increased over the last few months after a decrease in assets (QT) from June 10th through July 8th 2020. From there it gradually increased through much of the remainder of 2020. But even the slight drop at the end may have spooked the market in January. Quantitative Easing is like the Crack Cocaine of the stock market because you always need more to get a new high. And even a slight reduction brings the market down. Obviously, it can’t go on forever but like all politicians, the FED just wants to kick the can down the road a little further. But at some point, the day of reckoning will come. If the coming inflation causes the FED to stop QE the market will suffer.
FED Funds Rate
In the chart below, we can see that the FED Funds Rate peaked at 2.42% in April 2019 then the FED began fearing that it was holding too tight and the stock market was suffering so it began easing. It leveled off in November at 1.55% where it stayed until February. At that point, COVID tanked the market, and the FED loosened rates to 0.05% (five one-hundredths of a percent aka. virtually zero). In June they moved it up to eight one-hundredths of a percent and then in July, it inched up another one-hundredth of a percent. Then in August, it moved up another one-hundredth of a percent to 0.10% (i.e. one-tenth of 1%). Interestingly, even that was too high because they lowered it in September back to 0.09% where it has been since. So based on the FED Funds rate the FED does not appear to be tightening (which would involve raising the FED funds rate). Chart Source St Louis FED.
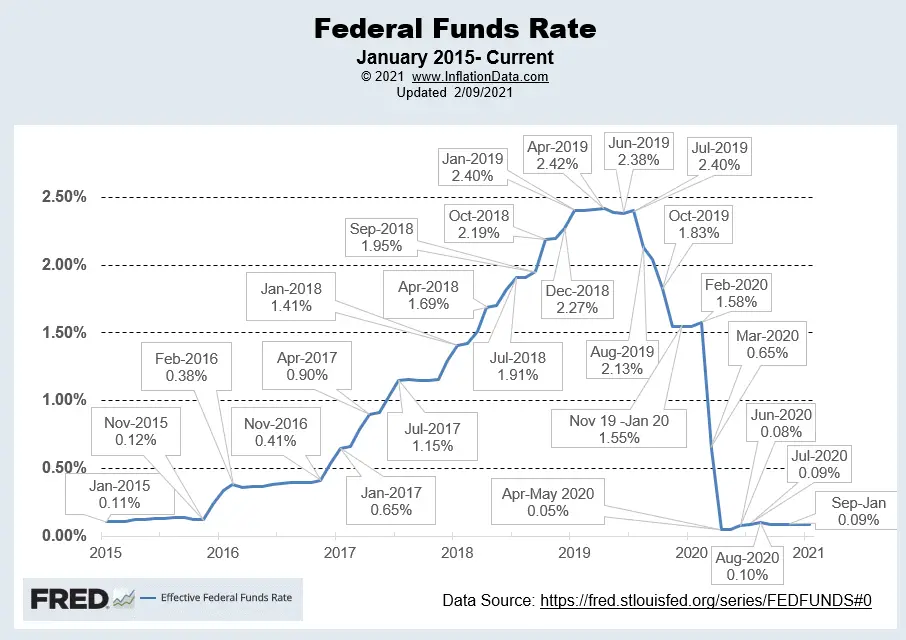
For more info See NYSE ROC and MIP.
Is Hyperinflation Coming?
Looking at the longer-term chart of FED Assets we can see the FED has engaged in 4 major phases of Quantitative Easing (QE) where they drastically increased their “assets” and one phase of Quantitative Tightening (QT) where they tried to decrease their assets. The most recent one has been almost a big as the other 3 combined. Previously most of the inflation went into the stock market.
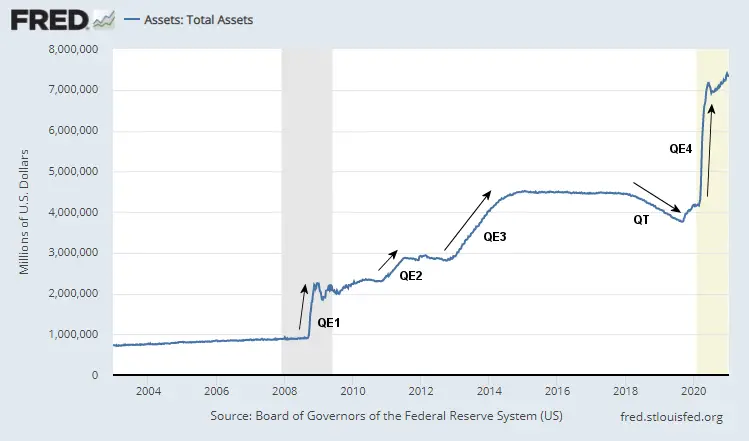
But as we can see in this chart of the M3 money supply that has changed recently.
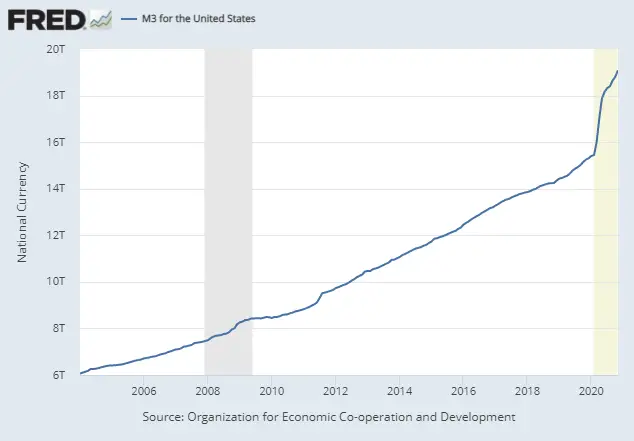
See: Why hasn’t the U.S. dollar experienced hyperinflation? for more info
Misery Index
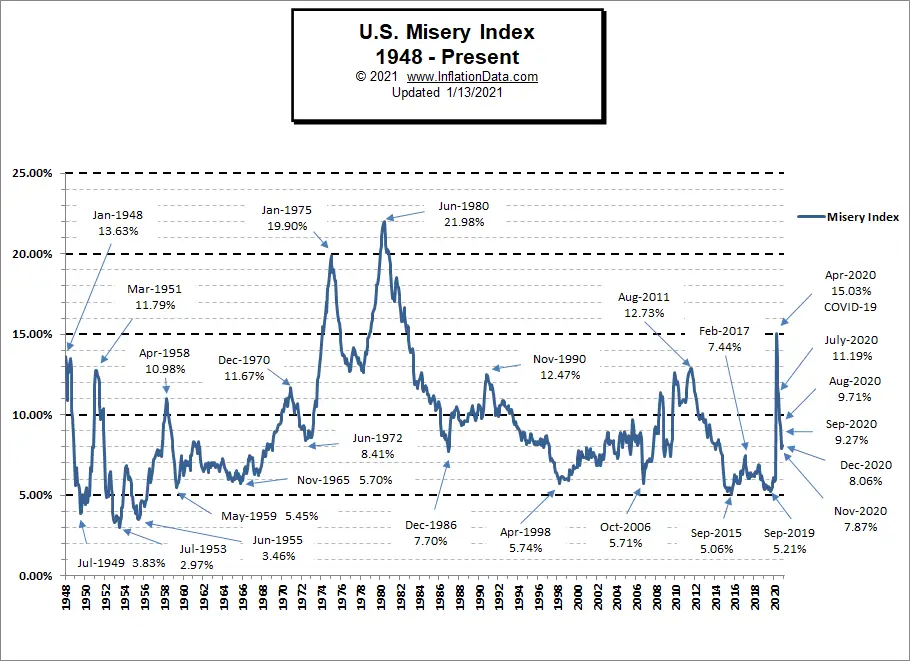 In September 2019, the Misery index bottomed near all-time lows at 5.21%.
By March 2020, it had climbed slightly to 5.94%. But in April, due to the COVID-19 shutdown and consequent high unemployment, the Misery Index shot up to 15.03% based on 14.7% unemployment and 0.33% inflation.
[Read More…]
NYSE Rate of Change (ROC)©
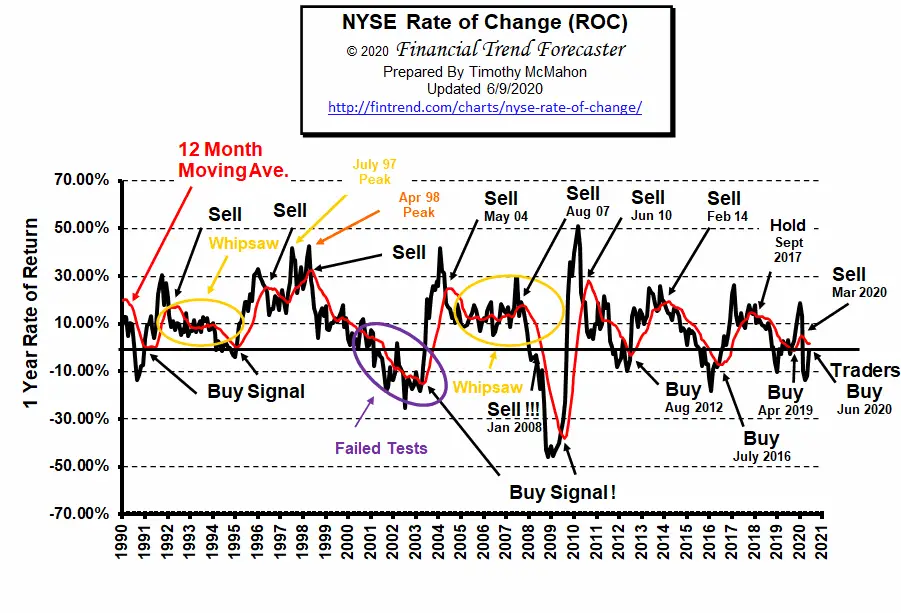
Hold? Signal (Whipsaw)
2020 was a giant rollercoaster ride (aka. whipsaw) for the NYSE. But there are indicators that the market may be topping.
See the NYSE ROC for more info.
NASDAQ Rate of Change (ROC)©
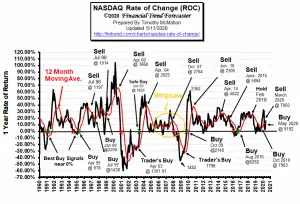
Hold Signal!
The ROC index is ABOVE its moving average. But as we said in the NYSE ROC these are uncertain times and combined with the lofty heights of the NASDAQ caution is warranted. Thus the HOLD Signal.
See NASDAQ ROC for more.
Regional Inflation Information
The U.S. Bureau of Labor Statistics also produces regional data. So if you are interested in more localized inflation information you can find it here.
| AL | AK | AR | AZ | CA | CT | CO | DC | DE | FL | GA | GU | HI | IA |
| ID | IL | IN | KS | KY | LA | MA | MD | ME | MI | MN | MO | MS | MT |
| NC | ND | NE | NH | NJ | NM | NV | NY | OH | OK | OR | PA | PR | RI |
| SC | SC | SD | TX | UT | VA | VI | VT | WI | WA | WI | WV |
You Might Also Like:
From InflationData.com
- Price and Wage Changes since 2000
- Why Hasn’t the U.S. Dollar Experienced Hyperinflation?
- Using Risk to Combat Inflation
- Emerging Technologies
Read more on UnemploymentData.com.
- Unemployment Goes From Extraordinarily Bad to “Only” Normally Bad
- How to Go Back to School as an Adult: The Steps Explained
- Create a Professional Resume
- How to Get a Job with No Experience
From Financial Trend Forecaster
- Top Financial Trends Shaping Banking
- The Death Of U.S. Shale Has Been Greatly Exaggerated
- China Ramps Up U.S. Crude Oil Imports
- Speed and Affordability: Cost of Internet Access Over Time
- New Technologies in the Oil and Gas Industry
From Elliott Wave University
- Spotting the Slide in Silver
- Market Participants are Extremely Bullish
- Why Most Investors Miss Major Stock Market Turns
- This High-Confident Trade Set-up Makes for Highly-Confident Traders
- Bond Market: “When Investors Should Worry”
From OptioMoney.com
- Smart Finance Moves: Questions to Ask Yourself Before You Buy a New Car
- Wealth Transfer: Estate Planning
- 5 Things to Consider When Managing Money in a Relationship
- Should You Buy a Second Home?
- Learning to Trade from Video Tutorials
From Your Family Finances
- What Are Your Options for Paying Medical Bills When Your Child Has a Birth Defect?
- How to Bless Your Family with Financial Security
- When Is It Time to Sell Your Old Car?
- 4 Ways to Make the Most of Investment Property Loans
- Why to Set up a Car Care Fund

Mr. McMahon,
a thank you from an overwhelmed but deeply appreciative reader. I am a DIY investor trying to find his way especially around the power of changes in the dollar to impact other investments. I am also a college professor trying to implore the next generation to consider more than that gov will magically take care of everything.
Your articles are well written and comprehensible to the less financially literate without over-simplification. Your charts are well done, and the accompanying notes are well-chosen and nicely integrated.
Your commentary is invaluable.
Thanks for offering.
Thanks! Glad I could be of help!