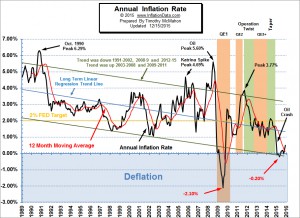
The Bureau of Labor Statistics (BLS) released their inflation numbers for the year ending November 30th on December 15, 2015. The Consumer Price Index (CPI-U) for November was 237.336 down from 237.838 at the end of October so overall prices declined -0.21% over the month but Annual Inflation was still up 0.50% (or ½%) for the year. This is the 4th month in a row where prices are lower than the previous month. In the table below we can see that last November the CPI was at 236.151. Then prices fell through January peaked in July and then fell to current levels. Month CPI-U Index Monthly Inflation Annual … [Read more...]
Are Oil Companies Ripping us off with Gas Prices?
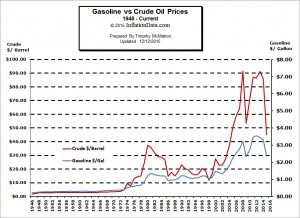
With the steady decline in gasoline prices during 2015 people aren't too concerned with the price of gas anymore. But on occasion crude oil prices have fallen without the corresponding decline in gasoline prices. When this occurs someone always asks me if the prices are actually correlated or are the oil companies just ripping us off. This prompted me to create a chart comparing the price of crude oil to that of gasoline so you can see for yourself how well they correlate and I recently updated that chart. See the full article here: Gasoline vs. Crude Oil Prices. You might also enjoy: Are Low Crude Oil Prices a “Boom Or A Curse” For The World Economy? Includes: Top 10 Crude … [Read more...]
October… 0.17% Annual Inflation but -0.05% Monthly Deflation
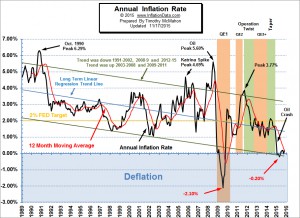
The Bureau of Labor Statistics (BLS) released their inflation numbers for the year ending October 31st on November 17, 2015. Although Annual inflation was positive at 0.17% monthly inflation was negative (disinflationary) for the third month in a row. This is the result of the CPI index falling consistently from a high in July 2015 of 238.654. In August it was 238.316 resulting in a monthly inflation for August of -0.14%. September 2015 was 237.945 for a monthly inflation rate of -0.16 and then October 2015 was 237.832 resulting in monthly -0.04%. However, Annual Inflation was still positive in two of the three months, i.e. August through October were 0.20%, -0.04% and 0.17% respectively. … [Read more...]
Fuzzy Inflation Logic
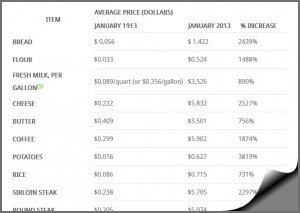
I recently received a scathing comment from "Cameron" on an article I had written several years ago entitled Food Price Inflation Since 1913. In the article I presented an interesting table that compared the prices of various food items between January 1913 and January 2013. I actually thought it was quite a good picture of price comparisons over a 100 year period. Here is a portion of one of the tables presented: Click for Full Table. Cameron took exception to fact that some items like flour increased by 1488%. Because of that he accused me of sensationalism and not taking into account inflation. At first I was confused, after all isn't the whole table about inflation? Then … [Read more...]
Deflation Returns in September

The Bureau of Labor Statistics (BLS) released their inflation numbers for the year ending September 30th on October 15, 2015. Monthly inflation was negative (disinflationary) for the second month in a row resulting in annual deflation of -0.04%. Although at this level the deflation is so slight that the BLS rounds it to Zero. So basically prices are on par with those of a year ago. However, that doesn't mean that all prices are identical to those of a year ago. In the report issued by the BLS yesterday we note that food prices are up 1.4% over a year ago while energy prices are down -18.4%. and all other items excluding food and energy are up 1.9% so we see that the primary cause of the … [Read more...]
CPI Index Down but Annual Inflation Flat
The Bureau of Labor Statistics (BLS) released their monthly Consumer Price Index (CPI-U) and Inflation report for the year ending in August on September 16th. The CPI index fell slightly from 238.654 in July to 238.316 in August resulting in monthly deflation but Annual Inflation for the year ending in August was 0.20% up from 0.17% for the year ending in July. That means that something that cost $100 a year ago would cost $100.20 today. That is compared to the typical inflation of around 3% which would mean that something that cost $100 last year would cost $103 this year. The CPI-U index a year ago was 237.852 and is currently 238.316. On an Annual basis Energy fell 15.0% over the … [Read more...]
July Inflation Numbers Minimal
The Bureau of Labor Statistics (BLS) released their monthly Consumer Price Index (CPI-U) and Inflation report for the year ending in July on August 19th . Annual Inflation came in at 0.17%. That means that something that cost $100 a year ago would cost $100.17 today. That is compared to the typical inflation of around 3% which would mean that something that cost $100 last year would cost $103 this year. The BLS rounds this to .2% which of course is so small that almost any one of the deflationary months last year would cancel out all the inflation we've seen over the previous 12 months. The CPI-U index a year ago was 238.250 and is currently 238.654. We have seen significant … [Read more...]
BLS Releases May Inflation Stats
May's monthly prices increase 0.51% but the annual inflation rate was still -0.04%. The Bureau of Labor Statistics (BLS) released their monthly Consumer Price Index (CPI-U) and Inflation report for the year ending in May on June 18th. This resulted in the 5th deflationary month in a row. We have seen a steady decline in inflation rates over the last year. May 2014 started with an annual inflation rate of 2.13%. June saw annual inflation fall to 2.07% then July declined to 1.99%, August was 1.70%, then September and October were both 1.66%, November was 1.32%, and December was 0.76%. When January rolled around it was … [Read more...]
Deflation Almost Zero
The Bureau of Labor Statistics (BLS) released the inflation statistics for the month of February on March 24th. According to the official numbers there was neither inflation nor deflation for the 12 months ending in February. Technically that wasn't exactly correct. The Consumer Price index (CPI-U) in February 2014 was 234.781 and in February 2015 it was 234.722. So actually there was -0.03% inflation and as we all know negative inflation on an annual basis is called "the big D" or Deflation. However, since the BLS rounds all their results to one decimal place they have rounded it to zero, that is prices are essentially the same as one year ago. Now before you send me nasty-grams saying … [Read more...]
Deflation Days are Here Again
The U.S. Bureau of Labor Statistics (BLS) released the Consumer Price Index (CPI-U) data today for the month of January. The verdict was that inflation had fallen rapidly from 0.76% in December to a slightly deflationary -0.09% for the 12 months ending in January. This is the first time since 2009 that we have seen Annual deflation although there were several times during 2014 that we saw monthly deflation. Monthly deflation (annual disinflation) means that prices are slightly lower than they were last month but still higher than a year ago, which typically happens a few times every year (generally in the 4th quarter), but this year prices began falling during the summer, indicating … [Read more...]
