
The Bureau of Labor Statistics (BLS) released the inflation statistics for the month of February on March 24th. According to the official numbers there was neither inflation nor deflation for the 12 months ending in February. Technically that wasn’t exactly correct. The Consumer Price index (CPI-U) in February 2014 was 234.781 and in February 2015 it was 234.722. So actually there was -0.03% inflation and as we all know negative inflation on an annual basis is called “the big D” or Deflation.
However, since the BLS rounds all their results to one decimal place they have rounded it to zero, that is prices are essentially the same as one year ago. Now before you send me nasty-grams saying “yeah-but” what about my favorite raisin nut bread which went from $3.00 to $3.50 a loaf? Let me say that just because the Consumer Price Index stayed the same it doesn’t mean that every item was identical. The major portion of the deflation came from gas and oil prices falling which also helped reduce some other energy dependent items as well. And of course electronics came down but… things like “meat, poultry, fish and eggs” increased 7.6%.
Medical care increased 3.9%…
Rent increased 3.5%…
and motor vehicle insurance increased 5.6%…
to name just a few categories.
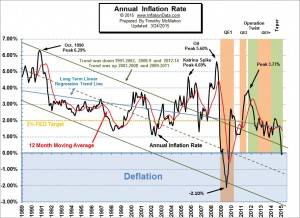 But all that was offset by an 18.8% decrease in energy costs. Over the last eight months we have had six months of monthly deflation (annual disinflation) i.e. prices are slightly lower than they were the previous month but still higher than a year ago. But January was the first time we had annual deflation (prices lower than a year earlier). This annual deflation is not the same nature as that of 2009 since that resulted from an implosion of the money supply (stock and housing market) while the current deflation is the result of lower energy prices. Most people will benefit from the current situation while most suffered in 2009. The one caveat of the current situation is that most of the job creation since 2009 has come from the energy sector and sustained lower prices could result in a loss of the primary driver for the current economy. See: Consumers Winning With Low Oil Prices, For Now, and 100,000 Layoffs and Counting: Is this the New Normal?, Current Annual Inflation Chart.
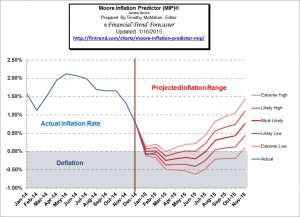 Just a few months ago, with inflation over 2% no one would have believed that deflation was so close at hand… but this copy of the Moore Inflation Predictor from a couple of months ago shows how we have accurately predicted the coming of deflation and the drop from 1% to below zero. See the current Moore Inflation Predictor chart to see where inflation is going next.


Leave a Reply