
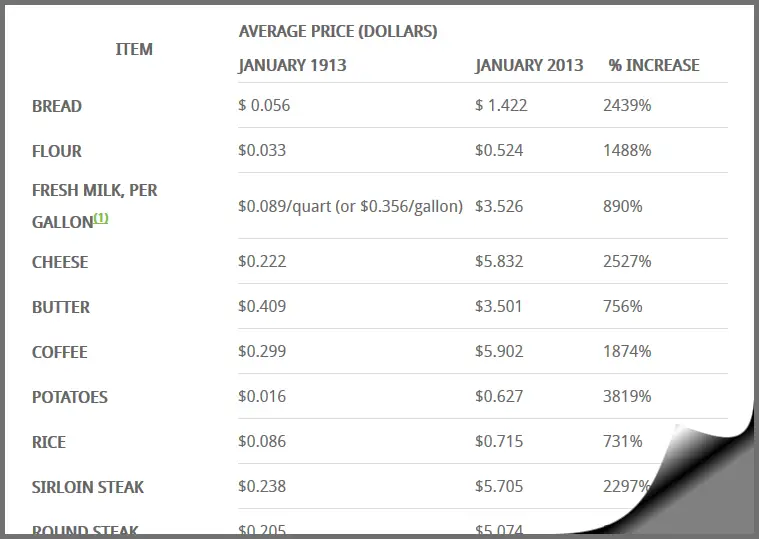
I recently received a scathing comment from “Cameron” on an article I had written several years ago entitled Food Price Inflation Since 1913. In the article I presented an interesting table that compared the prices of various food items between January 1913 and January 2013. I actually thought it was quite a good picture of price comparisons over a 100 year period. Here is a portion of one of the tables presented:
Cameron took exception to fact that some items like flour increased by 1488%. Because of that he accused me of sensationalism and not taking into account inflation. At first I was confused, after all isn’t the whole table about inflation? Then I realized that he meant I hadn’t accounted for “Wage inflation” although he didn’t realize that is what he meant.
Here is his comment and my response:
Cameron’s Comment:
This article is terrible. You did not account for the inflation of the dollar. Most of these prices are consistent with inflation, with some (like flour) actually being CHEAPER by todays standards.
If nothing else, this article goes to show the importance of data manipulation and the general spirit of statistical inaccuracies when all the relative data has not been accounted for.
I get that later on you try and show that percentage wise, Americans spend relatively similar amounts on food now as they did back then , but why even include a chart if it is so misrepresentative of the data set? Was it for hits on the cite? Was it for the sake of just throwing together a chart displaying disparity by thousands of percent? The chart serves no purpose, it only clouds the issue, and arguably was thrown in to mislead your readers.
TL;DR: The chart does not account for inflation of the dollar, in reality, after some research (research I would have thought the author would have included in his piece), the chart in actuality should read as a 1 to 1 price change, meaning any actual value change is inconsequential.
Poor use of data tables.
My Response:
Cameron, You seem to have a fuzzy understanding of what inflation is and how it works. This is understandable because the term inflation is used in two ways. The first is the cause and the second is the effect. The cause of inflation is an increase in the money supply (monetary inflation). The effect is an increase in prices (price inflation) and wages (wage inflation). Both cause and effect are often referred to as inflation (perhaps out of laziness or ignorance). But to make matters more complicated prices do not all increase equally or even consistently in the same direction.
Plus, some of the effects of price inflation are not the result of monetary inflation but rather the result of increases in demand or temporary restrictions in supply. A good example of this was when hurricane Katrina temporarily drove up the price of gasoline because some refineries had to be shut down. But the price of gasoline did not stay up and as a matter of fact recently the Saudis (in an effort to bankrupt alternative energy companies) increased supply and actually drove the price down to historical lows based on an inflation adjusted basis. See: inflation adjusted gas prices.
So supply and technology also affect prices. Computers are a good example of this. Computers are consistently getting cheaper even though the value of the money is getting less through monetary inflation. So at all times some items are getting more expensive and some are getting less expensive but the money supply is still increasing. What we call price inflation is actually a composite of all of the changes in prices of all the goods we buy.
One way of measuring it is through the Consumer Price index (CPI-U). This gives a weighting to 10,000 individual components that the average Urban consumer buys to estimate the overall increase they might feel. But even this does not accurately indicate any one individual since everyone’s purchasing habits are slightly different. And so a rural consumer might be radically different from an Urban consumer and even two urban consumers will allocate their purchasing dollars differently.
What this article illustrates is the actual prices that people paid during two different time periods. These are actual prices paid and not subject to adjustment. When presented as such there is no such thing as adjusting for inflation because the price differential demonstrates the inflation in and of itself.
It also demonstrates that monetary inflation does not affect all items equally. Sometimes technology overrides the effects of monetary inflation. The advent of advanced farming techniques has allowed grain to be grown more cheaply combined with mass produced milling techniques which has allowed the price of butter to actually decrease in comparison to the price of flour or bread. People no longer have to spend a major portion of their income on food but can instead spend an increased portion on things like Computers and X-Boxes.
But what you are referring to is the comparison of wage inflation to prices. In other words in addition to consumer prices increasing the average consumer has also experienced wage inflation. If wages had not increased no one would be able to afford to live. This results in our standard of living. If prices increase faster than wages then the standard of living goes down (which happened in the 1970’s and to a smaller extent in the period since 2000). On the other hand over much of the time since 1913 wages have increased more than the cost of commodities like flour so we can afford more than just food and clothes.
Remember in 1913 most people were farmers, farming was done with horses, there were no tractors, chemical fertilizers, cars or computers. The major activity of most people was producing enough food to support life. Taking your produce to the mill may have involved loading a wagon and driving it 20 miles (which would have taken you all day and even required an overnight stay so you could unload and return home the next day). People would take the money that they got for their produce and go to the store in town and buy many of their major purchases for the year (like a pair of shoes and a new set of clothes). This was one of the few paydays all year. Their annual income was likely a few hundred dollars (which by the way would have been paid in either gold coins or in I.O.U’s redeemable at local merchants. So assuming that their crops sold for $200 that would have been 10- $20 gold coins. Each coin contains roughly 1 oz of gold. So another way of calculating inflation is based on the price of gold. With gold currently at roughly $1100 per ounce… ten ounces would be the equivalent of $11,000. in today’s dollars.
Remember the title of the article was “Food Price Inflation Since 1913” the article was not structured to answer the question of wage inflation or standard of living but to simply cover the actual difference in prices between two time periods.
For more information see:
- What is the Real Definition of Inflation?
- Inflation and the Money Supply
- Can we have Inflation and Deflation?
- Another Way to Measure Inflation
- The Real Basket of Goods (Comparing Wages and Prices)

Very good reply. Great graph too! John