• Home
  • Related Sites
    • Financial Trend Forecaster
      • Moore Inflation Predictor
      • NYSE Rate of Change (ROC)
      • NASDAQ Rate of Change (ROC)
      • Crypto ROC- BTC & ETH
    • Unemployment Data
      • Historical Employment Data
      • Unemployment Rate Chart
      • Labor Force Participation Rate
    • Optio Money
    • Elliott Wave University
    • More Resources
  • Definitions
    • What is Inflation?
    • What is Core Inflation?
    • Inflation vs CPI
    • What is Deflation?
    • What is Disinflation?
    • What is Agflation?
    • What is Stagflation?
    • What is Hyperinflation?
    • What is Quantitative Easing?
    • What is Quantitative Tightening?
    • What is Velocity of Money?
    • What is Fiat Currency?
    • How Do I Calculate Inflation?
    • What are “Sticky Prices” and Why Do They Matter?
  • Featured Content
  • About Us
  • Feedback
    • Sitemap
  • Subscribe Now

InflationData.com

Your Place in Cyber Space for Inflation Data

CPIWidget-Feb26
  • Numerical Inflation Data
    • Current Inflation Rate
    • Monthly Inflation Rate (Moved)
    • Historical U.S. Inflation Rates
    • Historical CPI
  • Inflation Charts
    • Ann. Inf. Rate Chart
    • Long Term Inflation >
      • Ave. Inf. by Decade
      • Total Inf. by Decade
      • Inflation 1913-1919
      • Inflation 1920-1929
      • Inflation 1930-1939
      • Inflation 1940-1949
      • Inflation 1950-1959
      • Inflation 1960-1969
      • Inflation 1970-1979
    • Cumulative Inflation
    • FED Monetary Policy and Inflation
    • Inflation and Recession
    • Confederate Inflation (1861 – 1865)
    • Misery Index
    • The 3 Stages of Inflation
    • 15-Yr Inflation Trends Chart
  • Inflation Calculators
    • Cumulative Inf. Calc.
    • How Much Would it Cost
    • Salary Inf. Calc.
    • Cost of Living Calc.
    • U.K. Inf. Calc.
    • Cost of Gas Calc.
    • Net Worth Calc.
    • Lifetime Earnings Calc.
    • Savings Goal Calc.
    • Financial Calculators
  • Inf. Adjusted Prices
    • Energy >
      • Inflation Adj. Gas Prices
      • Historical Oil Prices Chart
      • Crude Oil Price (Table)
      • Natural Gas Prices
      • Electricity Prices
      • Oil vs Gold
    • Gold >
      • Inflation Adjusted Annual Average Gold Prices
      • Gold is a “Crisis Hedge” not an  “Inflation Hedge”
      • Comparing Oil vs. Gold
    • Corn Prices
    • Education Inflation
    • Housing Prices
    • Mortgage Rates
    • NYSE Index
    • Inf. Indexed Bonds
    • Movie Revenues
    • Inflation-Adjusted Wages
  • Cost of Living
    • Calculate Cost of Living
    • Cost-of-living Adj. (COLA)
    • Consumer Price Index CPI
      • Historical CPI
      • Current CPI
      • CPI Release Dates
    • Gas Prices >
      • Cost of Gas
      • Cost of Gas Per Month
      • Gas vs. Oil Price Chart
    • Food Prices 1913 vs 2013
    • Health Insurance
  • Blog
    • Key Inflation Articles
    • International Inflation
    • Historical Inflation Rates for Japan (1971 to 2014)
You are here: Home » Blog » Inflation » Are Oil Companies Ripping us off with Gas Prices?

Are Oil Companies Ripping us off with Gas Prices?

Published on December 13, 2015 by Tim McMahon Leave a Comment

With the steady decline in gasoline prices during 2015 people aren’t too concerned with the price of gas anymore. But on occasion crude oil prices have fallen without the corresponding decline in gasoline prices.

Crude Oil vs Gasoline Prices
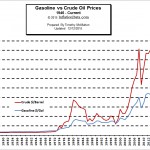
When this occurs someone always asks me if the prices are actually correlated or are the oil companies just ripping us off. This prompted me to create a chart comparing the price of crude oil to that of gasoline so you can see for yourself how well they correlate and I recently updated that chart.

See the full article here: Gasoline vs. Crude Oil Prices.

You might also enjoy:

  •  Are Low Crude Oil Prices a “Boom Or A Curse” For The World Economy?
    Includes: Top 10 Crude Oil Producing Countries, Oil prices needed for various oil producing countries to balance their budgets, marginal production costs for various countries, the severity of the recent crude oil price fall, the effects of falling oil prices on Russia, the effects of falling oil prices on OPEC, the correlation of crude oil prices and Saudi Arabian oil production and much more.
  • Strippers Suffering From Low Oil Prices– With OPEC breaking down and any kind of coordination among its members on price cuts looking increasingly unlikely, it now appears that oil prices could remain below $50 a barrel for a year or more. As producers confront this unpleasant reality, some will finally start to significantly curtail or even shut down operations. And that is going to severely hurt an all but invisible group; strippers in the United States.
  •  Inflation Adjusted Commodity Prices– What is the inflation adjusted price of common commodities?
  • Historical Oil Prices Chart– This Chart compares Monthly Average Oil Prices with their Inflation Adjusted Oil Price.
  • Annual Average Oil Prices in Table Form– shows Annual Average Crude Oil Prices from 1946 to the present. Prices are adjusted for Inflation using the Consumer Price Index (CPI-U) as presented by the Bureau of Labor Statistics.
  • Gold and Inflation– Is gold a good hedge against inflation?
  • Inflation Adjusted Gasoline Prices– In 1969 gasoline was only $0.35 a gallon. By 1976 it had risen to $0.60 per gallon. And by 1980 – 81 we were shocked as gas prices rose above $1.00 for the first time. In only 12 years gasoline had risen a full dollar from $0.35 to $1.35. That is an increase of 286% in 12 years! Because the overall value of the dollar has fallen, in order to compare the cost of gasoline over longer periods of time it is necessary to adjust the price for inflation.

About Tim McMahon

Connect with Tim on Google+.

  • Web
  • |
  • Twitter
  • |
  • Facebook
  • |
  • LinkedIn
  • |
  • More Posts(409)

Filed Under: Inflation Tagged With: gasoline, inflation, oil

Leave a Reply Cancel reply

Your email address will not be published. Required fields are marked *

This site uses Akismet to reduce spam. Learn how your comment data is processed.

Latest Posts

  • BLS Inflation Data Delayed
  • Updated Cumulative Inflation Calculator
  • Inflation-Adjusted Silver Prices
  • December Inflation Down Slightly, Not Flat
  • December 2025 Inflation Report for November
  • How Deflation Created the Middle Class
  • October Inflation Numbers Delayed
  • Why the 2.8% COLA May Fall Short of Real Inflation

Sponsored:

As a Seasoned Investor I thought I'd seen everything... But recently I discovered TradingView which has really improved the information I have at my fingertips.~ Tim McMahon, editor

TradingView gives me an edge... including powerful charting tools, real-time market data, and a global community of traders—all in one easy to use platform. It has hundreds of indicators, and even custom scripts for more advanced users, and you don't need to change Brokers just use its seamless brokerage integration... TradingView isn't just a charting tool—it's your full trading command center.

Trade smarter. Trade faster. Check Out TradingView for free.

----------

The Best Place to Buy Your Crypto

Coinbase is the largest Crypto Trading platform in the U.S. and the easiest to use. ~Tim McMahon, editor

Check out Coinbase here

Subscribe Now

eTrends Signup Form

Elliott Wave Resources

Free Elliott Wave Resources

What is Waveopedia?

Waveopedia is EWI’s free, comprehensive index of Elliott wave patterns and terms. Everyone from beginners to experts can benefit from it. It’s a great place to send your followers if they’re new to Elliott waves.

  • Deflation Hits China is the U.S. Next?

  • Why You Must Avoid the Herding Trap

  • Chasing Trends Can Cost You

  • More Education Resources

Post Archives

Home | Articles | Sitemap | Terms of Service | Privacy | Disclaimer | Advertise With Us

Copyright © 1996-2026 · Capital Professional Services, LLC · Maintained by Design Synergy Studio · Admin

Do Not Sell My Personal Information