
The Bureau of Labor Statistics (BLS) released their inflation numbers for the year ending October 31st on November 17, 2015. Although Annual inflation was positive at 0.17% monthly inflation was negative (disinflationary) for the third month in a row. This is the result of the CPI index falling consistently from a high in July 2015 of 238.654. In August it was 238.316 resulting in a monthly inflation for August of -0.14%. September 2015 was 237.945 for a monthly inflation rate of -0.16 and then October 2015 was 237.832 resulting in monthly -0.04%. However, Annual Inflation was still positive in two of the three months, i.e. August through October were 0.20%, -0.04% and 0.17% respectively. So even though prices are lower than they were last month they are still a bit higher than they were 12 months ago. But the main reason for that was because prices fell much more last October (2014) at -0.25% than they did this October. This might indicate that deflation is moderating. So let’s compare 2014 with 2015.
Monthly Inflation (Deflation)
Historically, the 4th quarter (i.e. October – December) has the most deflationary months with the first quarter (i.e. January – March being the most inflationary and the middle two quarters are generally moderately inflationary. But if we look at monthly inflation rates from July through December in 2014 and 2015 we see deflation starting earlier than normal. We also note that so far 2015 is only slightly less deflationary than 2014, with July – October 2014 at -0.38% and July – October 2015 at -0.34%. The major factor determining the Annual Inflation rate going forward however will be how November and December turn out since they were both extremely deflationary last year.
| 2014 | 2015 | |
| July | -0.04% | 0.01% |
| August | -0.17% | -0.14% |
| September | 0.08% | -0.16% |
| October | -0.25% | -0.04% |
| Total July-October | -0.38% | -0.34% |
| November | -0.54% | ??? |
| December | -0.57% | ??? |
Annual Inflation
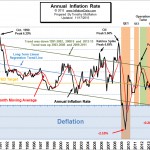 The Current Annual Inflation Rate chart plots the annual inflation rate since 1989. Note the downward trend with a peak at 6.29% in October of 1990 and then the Oil Peak in July 2008 was “only” 5.60%. Going back further (not shown) inflation peaked in March 1980 at 14.76%.
Annual inflation for the 12 months ending in October 2015 was up slightly at 0.17% from -0.04% in September. The BLS monthly report states ” The indexes for food, energy, and all items less food and energy all increased modestly in October. The food index, which increased 0.4 percent in September, rose 0.1 percent in October, with four of the six major grocery store food group indexes rising. The energy index, which declined in August and September, advanced 0.3 percent in October; major energy component indexes were mixed.”
Inflation Projections
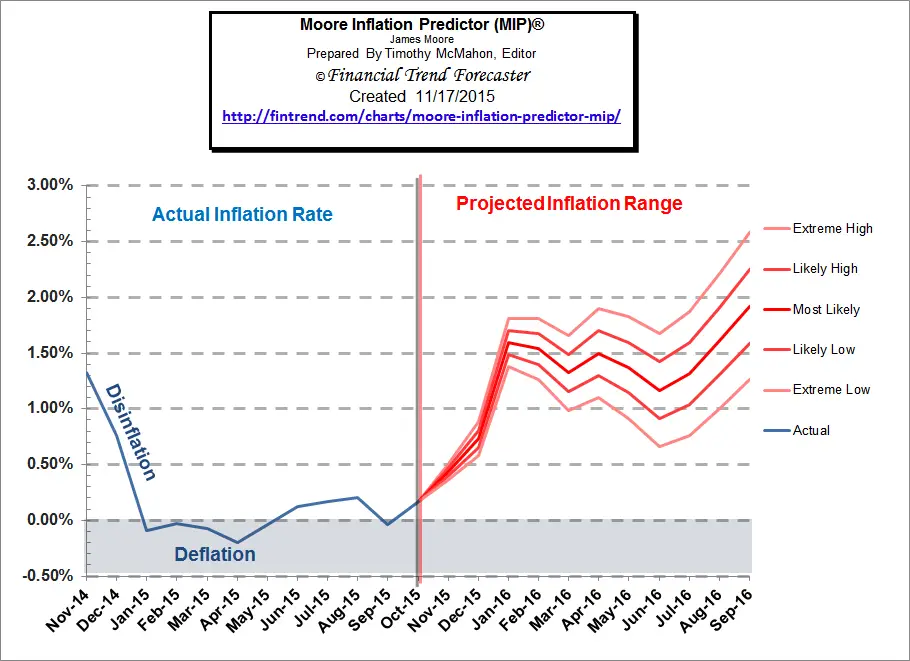 October’s monthly inflation rate was -0.04% the same as the entire annual inflation rate September 2014- September 2015 but because -0.25% fell out of the calculation Annual Inflation rose to 0.17% for the 12 months ending in October 2015. This is very close to August’s 0.20%. The interesting thing in this chart is the massive up-move through January and then the flattening afterward. The major vertical rise calculated for January 2016 is the result of January 2015’s monthly numbers being negative when typically they are strongly positive. So if this January is typical a negative number will fall out of the calculation and be replaced by a highly positive one thus giving us a strong increase in the annual inflation rate. However…
For more information see Inflation Forecast.
NYSE Rate of Change (ROC)
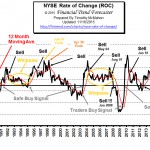
The NYSE has taken a three tumbles since August. On August 17th the NYSE closed at 10,818 and by August 25th it had fallen to 9,692 for a loss of 10.4% in just over a week. Then it rebounded bouncing between 10,000 and 10,250 before falling to a lower low at 9601 on September 28th. By November 3rd it had rebounded to 10609.92 but just 10 days later it had fallen to 10,155.07 for a 4.2% loss.
Last month we said that, “it isn’t out of the woods yet. There is considerable resistance between 10,500 and 10,750.”
Back in February 2014, the ROC generated a sell signal to get out at around 10,254 so you could have been safely invested in some sort of fixed income investments over that period and not missed any gains.
If you had earned 2% per year over the last 21 months your investments would currently be the equivalent of NYSE 10,579. Interestingly, the peak way back in 2007 was at 10,311. So we are just back to where the market was eight years ago. Looked at that way this hasn’t been that great of a bull market. And if we adjust for inflation… the market is still underwater.
See the New York Rate of Change chart for more info.
NASDAQ ROC
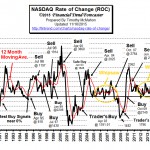 The NASDAQ index rose 2.35% over the previous month but the annual rate of return fell from 11.12% last month to 6.61% this month. This is still a respectable rate of return and considerably better than the NYSE which is currently looking at a year-over-year LOSS of -7.07%. But because the NASDAQ rate of return continues to be below its moving average the NASDAQ ROC continues its SELL signal!
See : NASDAQ Rate of Change for more information.
Misery Index
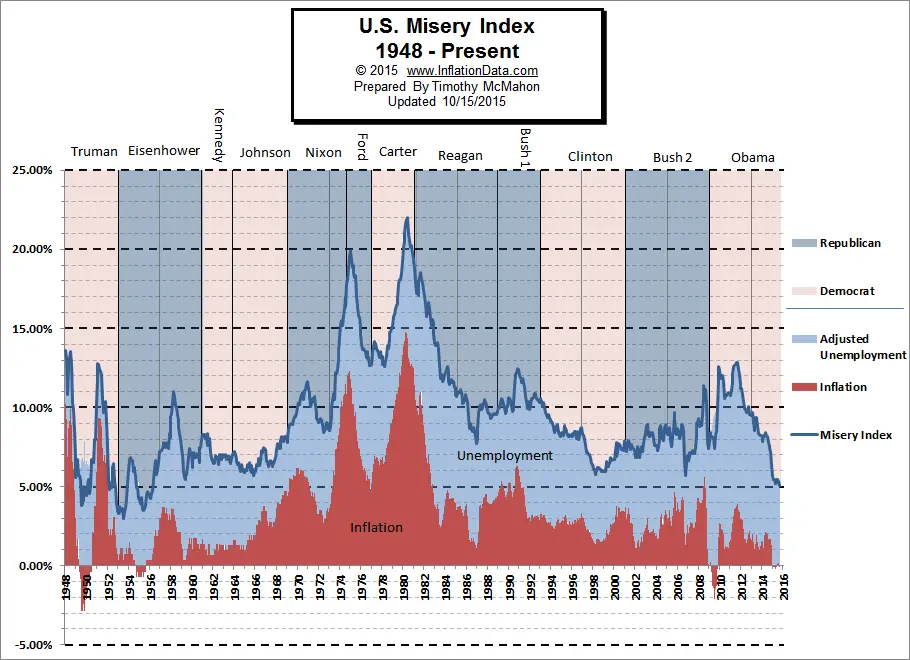 The misery index is an economic indicator designed to help determine how the average citizen is doing economically and it is calculated by simply adding the inflation rate to the unemployment rate. As of November 2015 (based on the most recent official government data for October 2015) is at 5.17% (5.0% unemployment and 0.17 inflation) down from a peak of 12.87% in both October and November 2011 which was pretty miserable. With inflation at historically low levels the major component of the Misery index is unemployment. The average inflation rate since the beginning of the Misery Index in January 1948 is 3.59% which is 3.42% higher than current inflation levels so if inflation were “average” the misery index would be much higher. More…

Leave a Reply