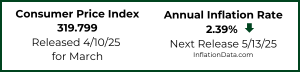
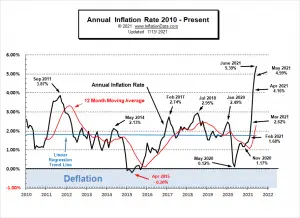
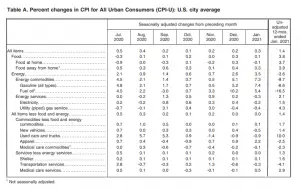
Inflation Summary: Annual Inflation up sharply to 5.39% CPI Index rose from 269.195 in May to 271.696 in June. Monthly Inflation for March 0.71%, April 0.82%, May 0.80%, and June was 0.93% . Next release August 11th Inflation for the 12 months ending in June was 5.39% for the Largest Annual Increase since July 2008's 5.60% Last month's 4.99% was the largest increase since August 2008's 5.37% but at 5.39% June 2021 was actually slightly higher than that. (Although the BLS reported them both as 5.4%). If inflation tops the 5.6% of July 2008, we have to go all the way back to the 6.29% of October 1990 to find a higher peak. We have been predicting Annual Inflation would … [Read more...]
The 3 Stages of Inflation
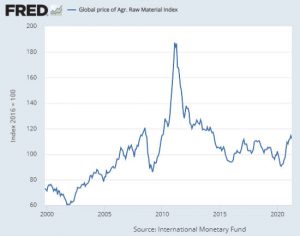
Inflation tends to arrive in 3 stages: Stage 1 The first stage is the price manufacturers pay for their raw materials. This can be tracked in a variety of ways including the Global Price of Agrigated Raw Materials published by the St. Louis Federal Reserve. Interestingly, raw materials prices peaked in February 2011 at 187.2 and then fell steadily over the next 4 years. Prices stabilized for a few years before plummeting due to COVID. Since then raw materials prices have spiked sharply. But are still nowhere near 2011 levels. One of the reasons for the sharp spike in 2011 was serious flooding causing massive crop loss driving the price of four basic crops (wheat, rice, corn, and soybeans) … [Read more...]
How Inflation Can Effect Rising Prices
In the field of economics, many experts agree that the long-term effects of inflation are dependent on the money supply in a country. Alternatively, the price levels are directly proportional to the money supply in the long run. Therefore, the money supply or the currency in circulation can directly affect the prices of goods and services. The confusion arises because both monetary inflation (an increase in the money supply) and price inflation (an increase in consumer prices) are both commonly referred to as "inflation". Even though many people consider money printing to be the cause of more money in circulation, physical paper in circulation is actually only a small percentage of the … [Read more...]
January Inflation Setting Stage for Big Run Up
Inflation Summary: Annual Inflation up from 1.36% in December to 1.40% in January. CPI Index rose slightly from 260.474 in December to 261.582 in January. Monthly Inflation for December was 0.09%, January was 0.43%. Next release March 10th Annual inflation for the 12 months ending in January was 1.40% The CPI index itself was up from 260.474 in December to 261.582 in January. Resulting in a monthly inflation rate of 0.43%. Annual inflation for the 12 months ending in December was 1.36%, the 12 months ending in January was 1.40%. Since the BLS rounds their numbers they report both as 1.4%. Setting the Stage for Inflation Due to the Corona Virus, March and April … [Read more...]
Why Hasn’t the U.S. Dollar Experienced Hyperinflation?
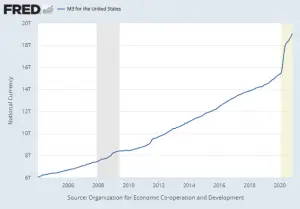
I recently answered this question on Quora and thought I'd share the answer here as well. Why hasn't the U.S. dollar experienced hyperinflation? That is an excellent question. As we can see from the chart the FED has engaged in 4 major phases of Quantitative Easing (QE) where they drastically increased their “assets” and one phase of Quantitative Tightening (QT) where they tried to decrease their assets. FED assets is sort of a euphemism for money printing. Basically, it involves creating money out of thin air and then buying something. That “something” becomes an asset on the FED’s books. Prior to 2008, the primary thing the FED bought was U.S. Treasury debt i.e. Treasury Bills, Bonds, … [Read more...]
Using Risk to Combat Inflation

Inflation is a fact of life that everyone must deal with. Even when inflation is "low", it gradually takes its toll on your assets. The result of low inflation is that your purchasing power gradually erodes even though you might have the same amount of money. In order to combat this, you have to earn more or increase the rate of return on your investments. Often a simple savings account won't even pay enough interest to cover the losses due to creeping inflation. In that case, the only way to beat inflation is to take on additional risk to increase your rate of return. Taking on additional risk, however, means that you could suffer other types of losses. So, in order to properly manage … [Read more...]
Long Term Inflation Charts Updated
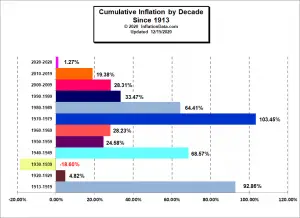
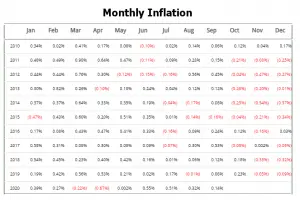
Average Inflation by Decade We've updated the long term inflation charts that appear around the site. These charts include Average Annual Inflation by decade i.e. what the average inflation rate was during the 1990s vs. the 1970s or the 2000s, etc. You can find these charts and more in-depth commentary in the following places: Average Annual Inflation Rates by Decade Total Inflation by Decade US Long Term Average Inflation Cumulative Inflation by Decade This is the amount of inflation experienced during … [Read more...]
September Inflation Virtually Unchanged
Annual Inflation Increased Very Slightly Annual Inflation rose from 1.31% in August to 1.37% in September. CPI Index rose from 259.918 in August to 260.280 in September. Monthly Inflation for August was 0.32%, for September it was 0.14. The FED holds steady on Assets and FED Funds Rates. Next release November 12th Annual inflation for the 12 months ending in September was 1.37% The CPI index itself was up from 259.918 in August to 260.280. Resulting in a monthly inflation rate of 0.14%. Annual inflation for the 12 months ending in September was up almost imperceptibly from 1.31% to 1.37%. This is a rebound from an astonishingly … [Read more...]
A Guide for Business Owners: How to Prepare Your Organization for Inflation
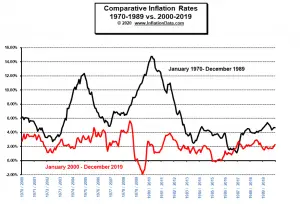
COVID-19 has brought the global economy to its knees and in response, the governments of the world have opened the money printing spigots. The U.S. FED for instance has bought roughly 3 TRILLION in assets this year (labeled "Quantitative Easing 4" on this chart). Many fear that this much "money printing" will result in massive inflation or even hyperinflation. As you can see from the chart below, high inflation rates were the bane of the 1970s and early 1980s when the inflation rate rarely dipped below 4%. By contrast, the period beginning with the new millennium has rarely seen inflation go above 4%. Inflation in the 1970s caused much suffering and business disruption, … [Read more...]
July’s Annual Inflation 0.99%
Annual Inflation Still Below 1% Annual Inflation rose from 0.65% in June to 0.99% in July. CPI Index rose to 259.101 in July. Monthly Inflation for July was 0.51%, June was 0.55%, May was 0.002%, April was -0.67%, March was -0.22%, February was 0.27%. The FED may be slowing its "Quantitative Easing" in an effort to prevent hyperinflation. FED Funds Rate up slightly but still remains near Zero. Next release September 11th Annual inflation for the 12 months ending in July was 0.99%, June was 0.65%, May was 0.12%, April was 0.33%, March was 1.54% down sharply from February's 2.33% and January's 2.49%. The CPI index itself was up from 257.797 in June to 259.101 in … [Read more...]
