Annual Inflation Still Below 1%
- Annual Inflation rose from 0.65% in June to 0.99% in July.
- CPI Index rose to 259.101 in July.
- Monthly Inflation for July was 0.51%, June was 0.55%, May was 0.002%, April was -0.67%, March was -0.22%, February was 0.27%.
- The FED may be slowing its “Quantitative Easing” in an effort to prevent hyperinflation.
- FED Funds Rate up slightly but still remains near Zero.
- Next release September 11th
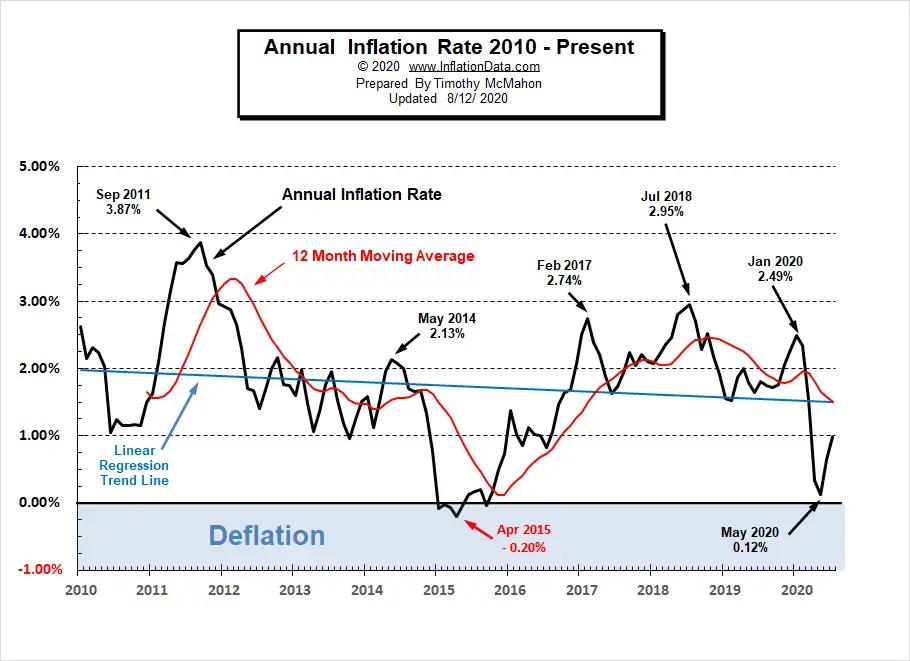
Annual inflation for the 12 months ending in July was 0.99%, June was 0.65%, May was 0.12%, April was 0.33%, March was 1.54% down sharply from February’s 2.33% and January’s 2.49%.
The CPI index itself was up from 257.797 in June to 259.101 in July. Resulting in a monthly inflation rate of 0.51% (accounting for the majority of the Annual Inflation).
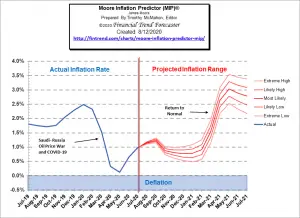 The Moore Inflation Predictor once again indicates an increase in inflation for the next few months but since they are typically low inflation months if we get another month like June or July the chart could be way low once again.
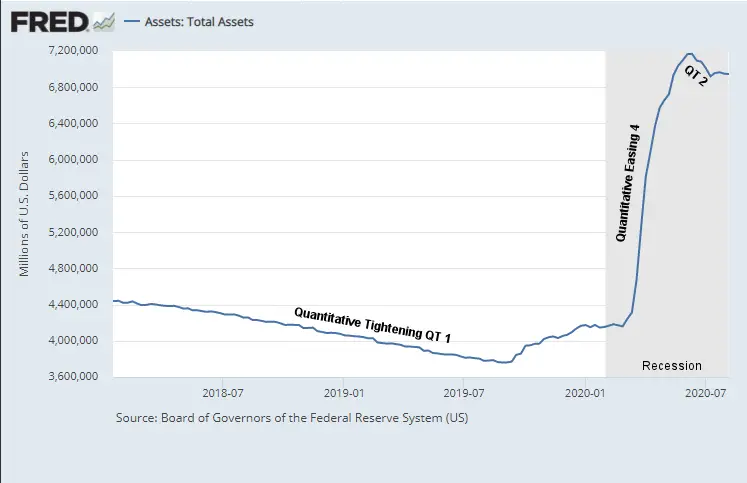
Currently, the inflation rate is still below the FED’s target 2% rate, the FED had been concerned with a market meltdown due to falling Oil prices and the Coronavirus. Over the months since the Coronavirus shutdown, the FED embarked on a massive money creation scheme of Quantitative Easing (QE4). But June saw a significant reduction in FED Assets and July saw them hold assets steady. So QE4 may be ending. See Is the FED Tightening or Is Hyperinflation on the Horizon?
Monthly Inflation:
According to the BLS commissioner’s report, “The Consumer Price Index for All Urban Consumers (CPI-U) increased 0.6 percent in July on a seasonally adjusted basis, the same increase as in June, the U.S. Bureau of Labor Statistics reported today. Over the last 12 months, the all items index increased 1.0 percent before seasonal adjustment.
The gasoline index continued to rise in July after increasing sharply in June and accounted for about one quarter of the monthly increase in the seasonally adjusted all items index. The energy index increased 2.5 percent in July as the gasoline index rose 5.6 percent. This was partially offset by the food index, which decreased 0.4 percent in July, with the index for food at home declining 1.1 percent.
The index for all items less food and energy rose 0.6 percent in July, its largest increase since January 1991. The index for motor vehicle insurance increased sharply in July, as it did the previous month. The indexes for shelter, communication, used cars and trucks, and medical care also increased in July, while the index for recreation declined.
The all items index increased 1.0 percent for the 12 months ending July, a larger increase than the 0.6-percent rise for the period ending June. The index for all items less food and energy increased 1.6 percent over the last 12 months. The food index increased 4.1 percent over the last 12 months, with the index for food at home rising 4.6 percent. Despite increasing in July, the energy index fell 11.2 percent over the last 12 months.”
Seasonally Adjusted Inflation Table
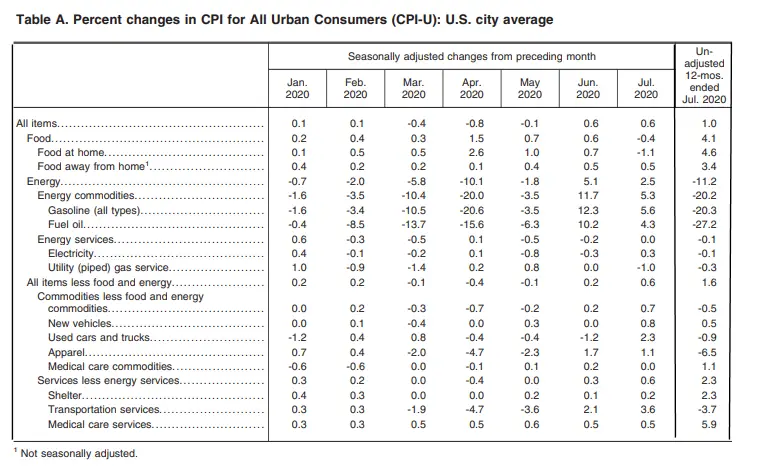 On the chart above, we can see that on an unadjusted basis inflation is up 1% for the year. We can also see that Energy is up 2.5% in July. But Energy is still down -11.2% for the entire year.
Current Inflation Situation
Inflation bottomed at 0.12% in May before climbing to almost 1% (0.99%) in July.
 Not Seasonally Adjusted Monthly Inflation Rates
Monthly inflation for June was 0.55% comprising the majority of the annual inflation since March and April’s deflation canceled out most of the rest of the year’s inflation.
| Jan | Feb | Mar | Apr | May | Jun | Jul | Aug | Sep | Oct | Nov | Dec | |
| 2016 | 0.17% | 0.08% | 0.43% | 0.47% | 0.41% | 0.33% | (0.16%) | 0.09% | 0.24% | 0.12% | (0.16%) | 0.03% |
| 2017 | 0.58% | 0.31% | 0.08% | 0.30% | 0.09% | 0.09% | (0.07%) | 0.30% | 0.53% | (0.06%) | 0.002% | (0.06%) |
| 2018 | 0.54% | 0.45% | 0.23% | 0.40% | 0.42% | 0.16% | 0.01% | 0.06% | 0.12% | 0.18% | (0.33%) | (0.32%) |
| 2019 | 0.19% | 0.42% | 0.56% | 0.53% | 0.21% | 0.02% | 0.17% | (0.01%) | 0.08% | 0.23% | (0.05%) | (0.09%) |
| 2020 | 0.39% | 0.27% | (0.22%) | (0.67%) | 0.002% | 0.55% | 0.51% |
See: Monthly Inflation Rate for more information and a complete table of Unadjusted Monthly Rates.
For more information See Annual Inflation.
Federal Reserve Actions
In the following chart, we can see QE4 and QT 1&2. Throughout all of 2018 and the first 3/4 of 2019, the FED eliminated roughly 1/3rd of QE3 but in the last three months of 2019, it realized it had over-done it a bit and ticked back up. Then in response to the recent Coronavirus crash, it has implemented QE4 equal in speed to QE1 and greater in magnitude than QE1, QE2, and QE3 combined. This is a MASSIVE increase in the money supply. But in June we see a decided decline. Many believe that this slackening will cause the stock market to crash.We cover this in-depth here.
FED Funds Rate
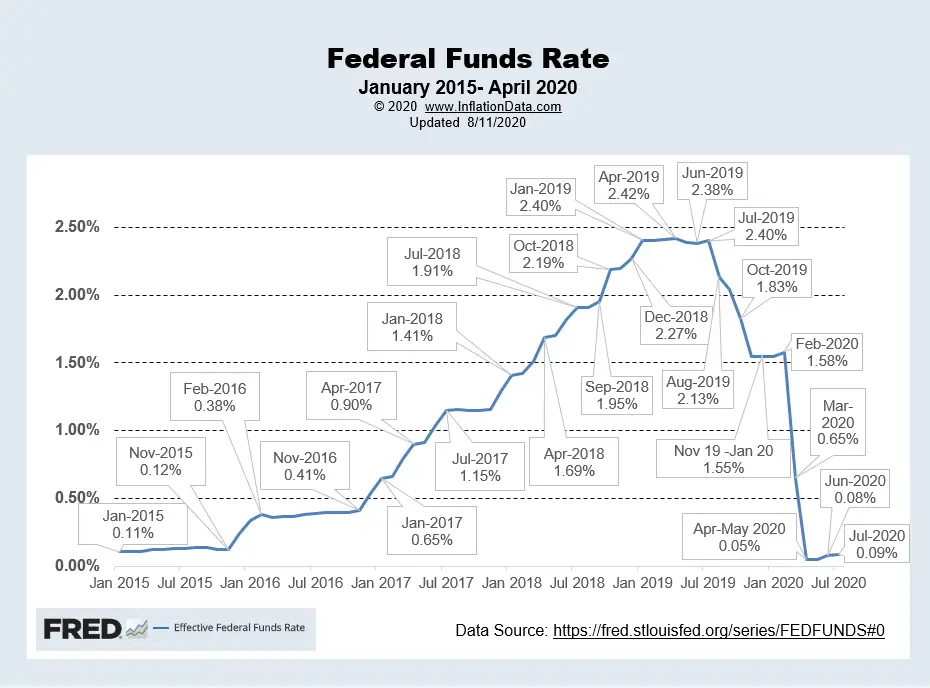
Beginning in March in an effort to fight a coming market crash due to falling oil prices and coronavirus fears the FED dropped rates to 0.65%. In April they reduced rates to virtually zero (i.e. 0.05%) and held it at that level in May. In June and July, they ticked it up nominally which was more symbolic than anything else since it is still only a few hundredths of a percent above zero.
For more info See NYSE ROC and MIP.
Misery Index
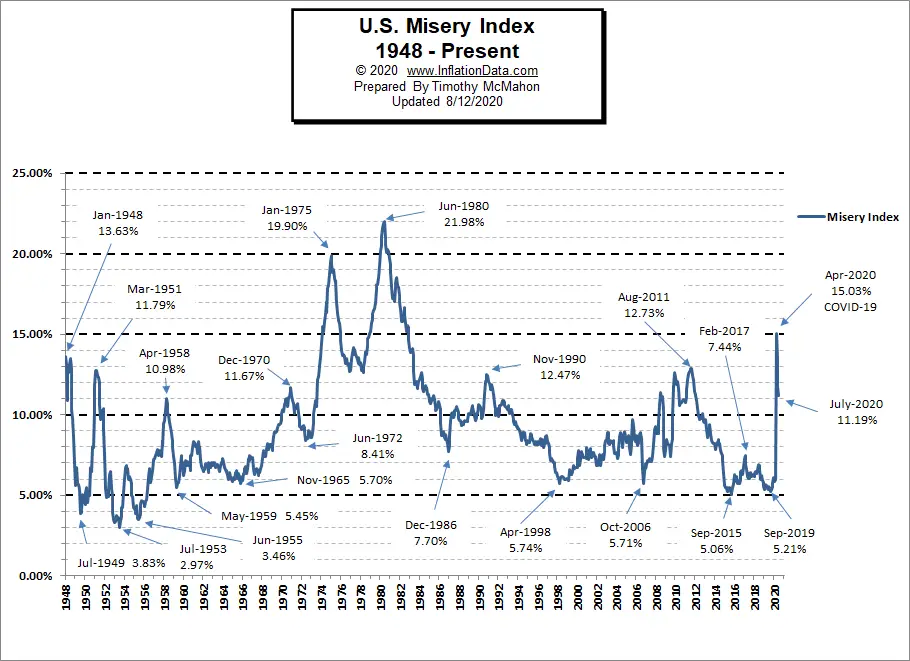
In April the Misery Index shot up to 15.03% based on 14.7% unemployment and 0.33% inflation. In May it fell back slightly due to a decrease in the Unemployment rate as some people began returning to work. By July unemployment had fallen to 10.2% and inflation had risen slightly to 0.99% resulting in a Misery index of 11.19%.
[Read More…]
NYSE Rate of Change (ROC)©
Buy? Signal
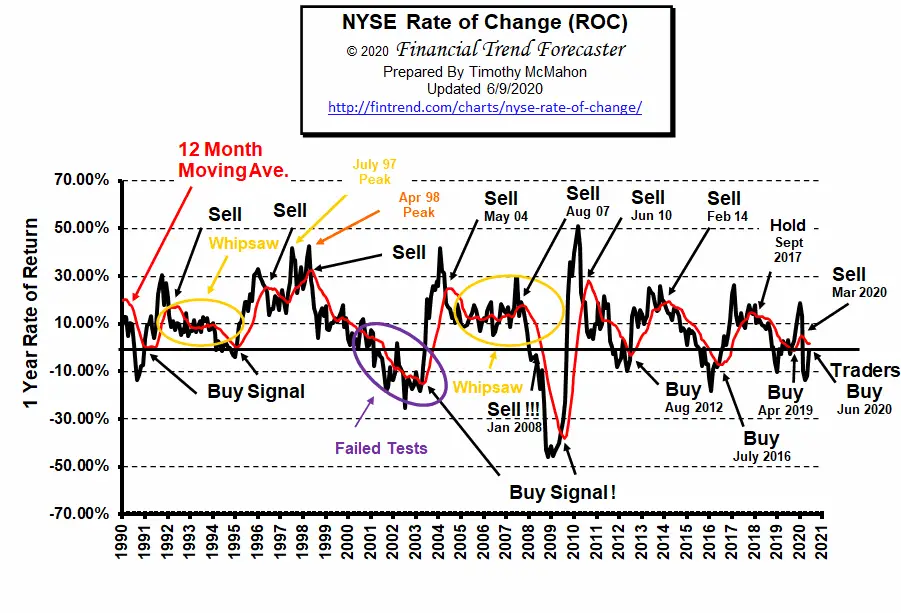
At this point we have a buy signal but we could easily see another whipsaw down moving us back to sell territory.
See the NYSE ROC for more info.
NASDAQ Rate of Change (ROC)©
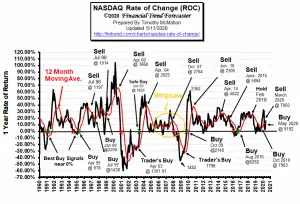
Hold Signal!
In August, it has tacked on another 3.7% gain resulting in an astounding 37% annual gain. This level of return can’t be maintained forever but it is possible to go higher from here as it did in 2000, 2003, and 2010. But as we said in the NYSE ROC the FED might be tightening and Summer doldrums are approaching so caution is warranted.
See NASDAQ ROC for more.
Regional Inflation Information
The U.S. Bureau of Labor Statistics also produces regional data. So if you are interested in more localized inflation information you can find it here.
| AL | AK | AR | AZ | CA | CT | CO | DC | DE | FL | GA | GU | HI | IA |
| ID | IL | IN | KS | KY | LA | MA | MD | ME | MI | MN | MO | MS | MT |
| NC | ND | NE | NH | NJ | NM | NV | NY | OH | OK | OR | PA | PR | RI |
| SC | SC | SD | TX | UT | VA | VI | VT | WI | WA | WI | WV |
You Might Also Like:
From InflationData.com
- 3 Factors Causing the Current Gold Rally
- Inflation Quintuples… Still Below 1%
- Is the FED Tightening or Is Hyperinflation on the Horizon?
- 5 Countries Most at Risk for Deflation
Read more on UnemploymentData.com.
- Employment Up by a Half-Million in a Typically Bad Month
- 4 Jobs with Higher Job Security
- Wrongful Termination: Can You Get Fired for Being Disabled?
- Save Money By Downsizing After Losing Your Job
- 5 Things You Can Do to Improve Your Employment Opportunities
- Remodeling a Commercial Property
From Financial Trend Forecaster
- Saudi Arabia Eyes Total Dominance In Oil And Gas
- 4 Investments Making Waves in the Technology Sector
- Mutual Funds
- Bulls Beware: A Dark Cloud Is Forming Over Oil Markets
From Elliott Wave University
- Forecasting Markets by Looking at Chart Patterns
- Seeking Certainty in Uncertain Times?
- Emerging Markets and Epidemics
- Deflationary Psychology Versus the Fed: Here’s the Likely Winner
- Crude Oil’s 2020 Crash: See What Helped (Some) Traders Pivot Just in Time
From OptioMoney.com
- Should You Buy a Second Home?
- Learning to Trade from Video Tutorials
- How Saxo Bank Democratizes Trading and InvestmentFive Business Tips to Help Your Company Thrive
- Have Minimal Car Insurance? What to Do in Case of an Accident
- How to Choose a Residential Roofing Contractor
From Your Family Finances
- Practical Budgeting Tips for Big Families
- How to Make a New Car Affordable
- Teach Your Kids About Money Management
- 4 Ways to Save on Internet Expenses
- 4 Types of Trusts That Can Protect Your Assets


Leave a Reply