
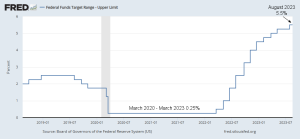
Why Has The FED Been Raising Interest Rates? The Federal Reserve (Fed) started raising interest rates in March 2022 in an effort to combat inflation. As of the end of July 2023, the Fed's target rate limit is 5.5%, the highest level in 15 years. There are a few reasons why the Fed is raising interest rates so aggressively. First, inflation was at a 40-year high. In June 2022, the Consumer Price Index (CPI) rose 9.06% year-over-year, the fastest pace since December 1981. This means that the cost of goods and services was rising rapidly, which was eroding the purchasing power of consumers and businesses. Second, the economy is still strong. The unemployment rate posted a 50-year … [Read more...]
November FED Announcement Rocks Stock Market
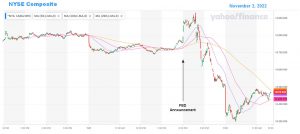
The FED Giveth and the FED Taketh Away On Wednesday, November 2nd, the FED held its "Federal Open Market Committee meeting" and made the announcement the market has been breathlessly awaiting. As expected, Chairman Jerome Powell announced a hike of 75 basis points in the fed funds rate. Along with the announcement, the market was hoping for some indication of a "pivot", i.e., that the FED would give some indication that it was going to be slackening off on its rapid rate increases. And in this respect, the November FED Announcement did throw the market a bone. It added the new phrase “Cumulative Tightening” to the standard announcement. So, going forward, the FED will take the fact … [Read more...]
Jerome Powell “Channels” His Inner Paul Volcker
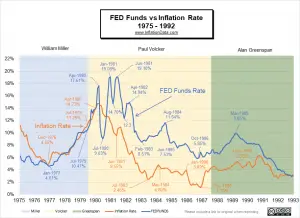
Federal Reserve Chairman Jerome Powell is sounding more and more like former FED Chairman Paul Volcker, who served as the chairman of the Federal Reserve from August 1979 to August 1987. Volcker is best known for his historic fight to vanquish inflation in the early 1980s. Before Volcker took over as the head of the FED, Inflation had risen from a low of 4.65% in December 1976 to 11.26% in July 1979. During that time, FED chairman William Miller raised the FED funds rate from 4.61% to 10.47% in July of 1979. During Miller's time, the FED funds rate pretty much tracked the inflation rate, with a couple of month lag. Prior to Volcker, the prevailing monetary theory was that the FED … [Read more...]
FED Issues September 2021 Statement
On September 22, 2021, the Federal Reserve reported its current policy position. Currently, the FED is creating liquidity (i.e., printing money) through its Quantitative Easing (QE) program at the rate of $120 billion per month. The market has been fearing that the FED would begin tapering, i.e., cutting back on its liquidity creation. Rumor was that the FED would start reducing their QE by $10-$15 billion per month due to inflation concerns. The last time the FED embarked on a tapering plan back in 2017, they used a two-prong approach of raising the FED Funds rate and reducing the monthly printing by $10 Billion every three months (i.e., roughly $3.3 billion per month). The result of … [Read more...]
The Relationship Between Inflation and Interest Rates: Explained
"Macroeconomics" deals with the "big picture" of how things fit together in the economy as a whole, while "microeconomics" deals more with how it affects the individual. Here at InflationData, we generally look at the macro side and leave the economics of the individual to our sister sites like Your Family Finances. Today we are going to look at the macroeconomic implications of the link between inflation and Interest rates. ~Tim McMahon, editor The Macroeconomic Link Between Inflation and Interest Rates By George J. Newton Price Inflation is the rate at which the price of goods and services rises in the economy over a period of time. Monetary inflation is the increase in the money … [Read more...]
Annual Inflation in October is 1.18%
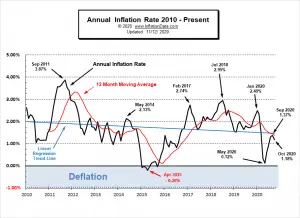
Inflation Summary: Annual Inflation fell from 1.37% in September to 1.18% in October. CPI Index rose slightly from 260.280 in September to 260.388 in October. Monthly Inflation for September was 0.14% and only 0.04% in October. FED Funds Rates decrease slightly while FED Assets inch up. Next release December 10th Annual Inflation Chart: Looking at the Annual Inflation Chart since 1989 we can see a marked downward trend. Current Inflation Situation Looking at just the most recent 10 years the trend is … [Read more...]
July’s Annual Inflation 0.99%
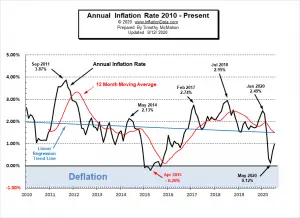
Annual Inflation Still Below 1% Annual Inflation rose from 0.65% in June to 0.99% in July. CPI Index rose to 259.101 in July. Monthly Inflation for July was 0.51%, June was 0.55%, May was 0.002%, April was -0.67%, March was -0.22%, February was 0.27%. The FED may be slowing its "Quantitative Easing" in an effort to prevent hyperinflation. FED Funds Rate up slightly but still remains near Zero. Next release September 11th Annual inflation for the 12 months ending in July was 0.99%, June was 0.65%, May was 0.12%, April was 0.33%, March was 1.54% down sharply from February's 2.33% and January's 2.49%. The CPI index itself was up from 257.797 in June to 259.101 in … [Read more...]
What is the Federal Funds Rate?
By law banks are required to maintain a certain percentage of their assets in reserves at any given time. This money is held at the Federal Reserve bank and is called the “Reserve Requirement”. Generally, this money does not earn any interest. But, any money over and above this minimum can be loaned to other banks to who might not have enough reserves. The rate that banks can charge each other is called the “Federal Funds rate” or “Fed Funds Rate”. The monetary policy-making body of the Federal Reserve System, is called the “Federal Open Market Committee” or “FOMC”. The FOMC meets eight times a year to discuss the economy and decide on any changes to monetary policy. One of the major … [Read more...]
