
I recently answered this question on Quora and thought I’d share the answer here as well.
Why hasn’t the U.S. dollar experienced hyperinflation?
That is an excellent question. As we can see from the chart the FED has engaged in 4 major phases of Quantitative Easing (QE) where they drastically increased their “assets” and one phase of Quantitative Tightening (QT) where they tried to decrease their assets.
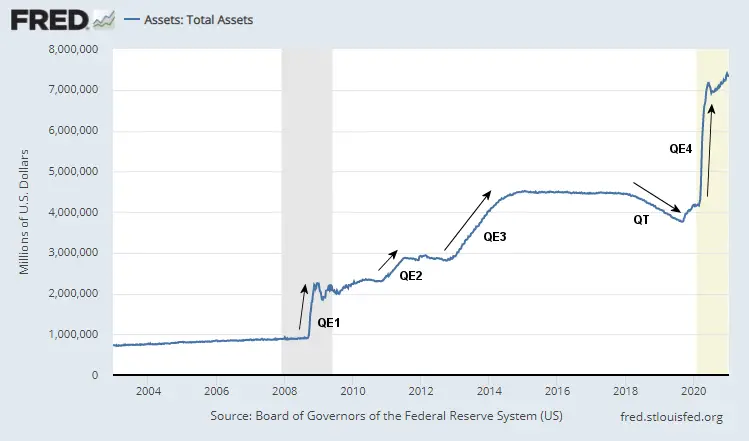
FED assets is sort of a euphemism for money printing. Basically, it involves creating money out of thin air and then buying something. That “something” becomes an asset on the FED’s books. Prior to 2008, the primary thing the FED bought was U.S. Treasury debt i.e. Treasury Bills, Bonds, and Notes. And then they got the idea that they could buy other things. And Quantitative Easing was born in response to the 2008 stock market crash.
What they began buying is a bit uncertain but a look at what happened when they tried the reverse (i.e. selling assets via Quantitative Tightening) we can get a good idea.
In 2018, the FED raised interest rates slightly and began Quantitative tightening. And the stock market crashed. The NYSE started 2018 at 12,860 and ended the year at 11,338 for an 11.8% decrease over the year. And that is almost precisely the period that the FED followed a QT policy. So from that, we can surmise that QT depresses the market and QE boosts the market. And if the “assets” the FED is buying are stocks that would make perfect sense. Selling pressure would drive the stock price down and buying pressure would drive the stock price up. Although I have not been able to find any data on what exactly the FED is buying in QE. But it is obvious that somehow they are pumping liquidity into the stock market.
So that brings us back to the question: Why hasn’t the U.S. dollar experienced hyperinflation? If the FED is massively boosting their assets and consequently boosting the money supply why is the inflation rate (as of December 2020) only 1.36%?
Part of the reason is that the annual inflation rate is made up of 12 monthly inflation rates. And due to COVID several of those months in early 2020 were negative or very low. March and April combined knocked almost a whole percentage point off the annual inflation rate, so when they fall out of the calculation the annual inflation rate will instantly jump up roughly 1% taking it to at least 2.3%. But since the FED target for inflation is 2% a 2.3% inflation rate still isn’t anywhere near hyperinflation levels.
So where did all that money creation go?
To understand that we have to look at what is generally considered the money supply. M1 money supply is very liquid assets like Checking accounts. M2 includes M1 plus savings accounts, CDs, and Money Market Mutual Funds. M3 is much broader and includes all the money the “Big Boys” have like large-denomination ($100,000 or more) time deposits, balances in institutional money funds, repurchase liabilities issued by depository institutions, and Eurodollars held by U.S. residents at foreign branches of U.S. banks and at all banks in the United Kingdom and Canada. In the chart below we can see the growth of M3 over the years.
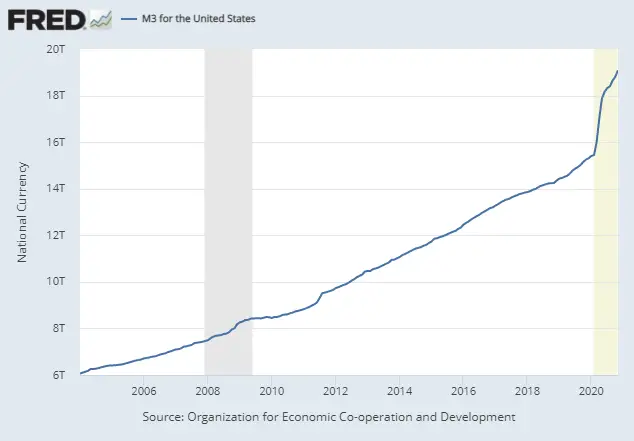
The grey vertical bar indicates recession. Notice the little blip up in the middle of the recession? That is the massive increase in FED assets. So if FED assets increased massively why didn’t M3 increase that much? The answer is the stock and housing market. Neither is not part of M3 even though a normal person would consider both as assets and part of their overall wealth. But you can’t really spend your house (without taking out some sort of debt) and the stock market just isn’t counted in the money supply so when the FED did their first QE most of the money simply went to reinflate the stock market and housing prices which had both suffered massive deflation (with both losing roughly half of their previous value). In 2011 you can see the effects of QE2 and there is a steady increase in 2013 for QE3 and all the way up through 2018 when the M3 flattens out but doesn’t decrease like the FED assets did.
So part of the reason we haven’t seen hyperinflation is that the majority of the inflation has flowed into what people consider “good inflation” i.e. the price of their investments like the stock market and their house. One of the causes/results of hyperinflation is an increase in the velocity of money i.e. how fast people rush out to spend what they have. The more people worry about their money losing its value, the faster they spend it, even if they don’t really need what they are buying. And because they are in such a rush, they don’t have time to shop around for the best price so prices tend to go up. Because people see their investments and house values going up they put more money there are don’t rush to spend it on commodities like food. So there is more upward pressure on stocks than on food.
Another reason that prices for commodities not increasing in price that fast is Amazon/China. Because Amazon has made it very easy to buy products from around the world we are able to export some of our inflation overseas to places like China. So workers there can see their wages go from 50 cents to $1 a day. As we purchase products from China, the Chinese pay their people in local currency and the government increases its holdings of U.S. dollars. These dollars become part of the overseas holdings but can still be counted in M3 even though they aren’t really circulating around the U.S. causing price inflation.
The final reason we haven’t seen hyperinflation yet is timing. Generally, an increase in the money supply doesn’t show up in general pricing for 1 to 2 years (depending on current perceptions, i.e. the velocity of money). It takes time for the money to begin circulating and for people to realize that there is more money than goods. Also, it has been 30 years since we’ve seen inflation greater than 6% so all the millennials have never even seen real inflation so they are unconcerned. There was a brief peak just before the 2008 crash but it was so brief that it is hardly remembered. The last double-digit inflation we had was back in 1980–81. As we can see from this chart inflation has actually been trending down since the peak in October 1990.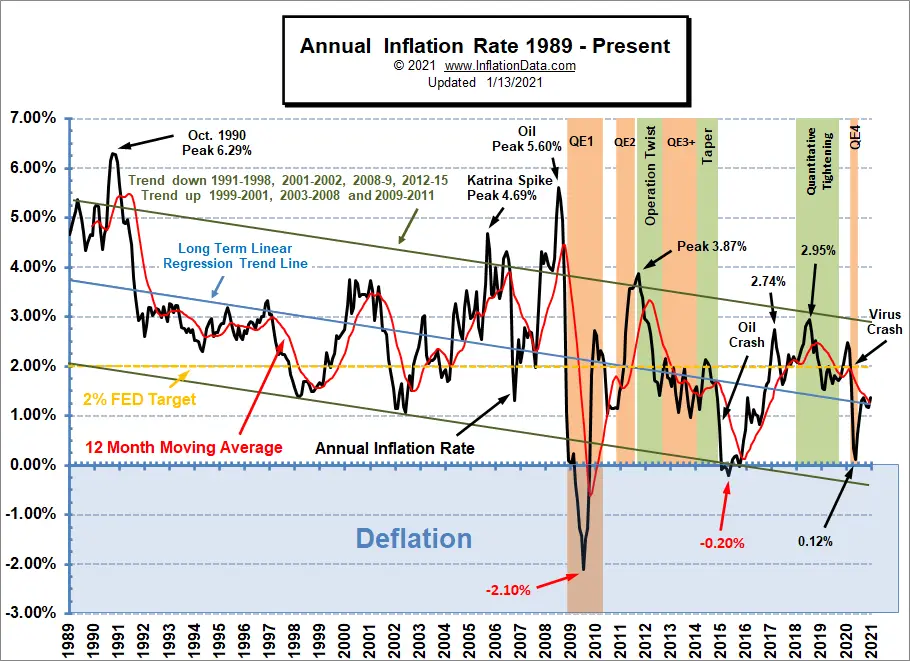
The massive increase in QE4 however did cause a huge spike in M3 and so we could be in for more inflation or even hyperinflation as all that money looks for someplace to go, especially if people become disillusioned with the stock market. And the final vertical bar on the M3 and FED Assets charts indicate that we have been in an official recession since the COVID shutdown began in 2020.
So just because we have not yet seen massive inflation doesn’t mean that it won’t appear in the next 12 to 24 months.
You might also like:
- What is Hyperinflation?
- What is Quantitative Easing?
- What is Quantitative Tightening?
- What is Velocity of Money?

Leave a Reply