Every so often I get a reader who writes a comment accusing me (although the numbers actually come from the Bureau of Labor Statistics) of underestimating the actual inflation rate. He reasons that, since his favorite bread cost $3.00 last year and now it costs $3.50... how can inflation possibly be only 2%? Typically my answer has been that individual items can change but actually cancel each other out. Such as in February 2015 when things like “meat, poultry, fish and eggs” increased 7.6% but energy prices fell enough to make the overall CPI slightly less than zero (i.e. deflationary). But this month we actually see evidence of another explanation. Annual Inflation for the year ending … [Read more...]
October Data says Disinflation
The U.S. Bureau of Labor Statistics released the Annual Inflation Rate data for the year through the end of October on November 15th 2017. Annual inflation was 2.04% in October down from 2.23% in September. CPI-U 246.663 Monthly Inflation for October -0.06% Next release December 13th Monthly Inflation is Negative Whenever the monthly inflation rate is negative that is called "disinflation" i.e. prices have gone down since the previous month. If the annual inflation rate is negative that is called "deflation". In October we had disinflation as prices fell slightly (but not below year ago levels). The CPI-U index fell from 246.819 in September to 246.663 in October. … [Read more...]
The Quantity Theory of Money
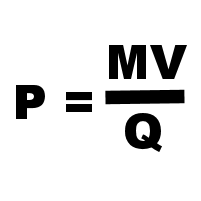
We have written quite extensively on the cause of inflation in articles like: How does the Money Supply affect our Inflation Rate? in What is Inflation? and Inflation Cause and Effects. One of the keys to understanding inflation is the Money Multiplier. Because of the "Fractional Reserve system banks are only required to keep a small fraction of the money on deposit as "reserves" against potential withdrawals the bank can loan out the majority of the money on deposit to earn interest. This results in a multiplication effect increasing the money supply by vast multiples. This "leverage" can work in either direction. In April 2010, I wrote an article explaining how this can result in … [Read more...]
Inflation Up, NYSE New High
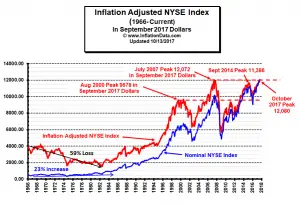
Current Inflation Situation On October 13th the Bureau of Labor Statistics released the Consumer Price Index inflation information for September. The CPI-U index was 246.819 up from 245.519 in August. This resulted in an annual inflation rate for the 12 months through September 2017 of 2.23% up from 1.94% in August, 1.63% in June and 1.73% in July. Monthly inflation was a whopping 0.53% for September primarily due to a 12% increase in gasoline prices due to refinery shutdowns in response to hurricanes. See our Annual Inflation Chart for more info. NYSE Makes New High in Inflation Adjusted Terms! To get a true picture of the state of the market it helps to look at the … [Read more...]
Monthly Inflation Spikes in August
The U.S. Bureau of Labor Statistics released the Annual Inflation Rate data for the year ending in August on September 14th 2017. Annual inflation was 1.94% in August up from 1.73% in July. CPI-U 245.519 Monthly Inflation for August 0.30% Next release October 18th According to the U.S. Bureau of Labor Statistics (BLS) - "Increases in the indexes for gasoline and shelter accounted for nearly all of the seasonally adjusted increase in the all items index. The energy index rose 2.8 percent in August as the gasoline index increased 6.3 percent. The shelter index rose 0.5 percent in August with the rent index up 0.4 percent. The food index rose slightly in August, with the … [Read more...]
OECD International Inflation Rates
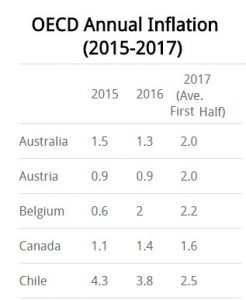
On Friday August 11th the OECD published the Annual Inflation Rates rates of its member countries plus several other countries as well. Noticeably absent is Argentina. The OECD included the following footnote: Data for Argentina are currently not available due to the state of emergency in the national statistical system declared by the government of Argentina on 07 January 2016. As a consequence, Argentina is not included in the calculation of the G-20 aggregate. The policy regarding the inclusion of Argentina will be reconsidered in the future depending on further developments. In November 2015, Mauricio Macri was elected in Argentina under the platform of reforming the government of … [Read more...]
Inflation Down in May But Real Estate Booming (or is it?)
Annual inflation for the 12 months ending in May 2017 was 1.87%. Inflation has steadily moved lower month by month from its peak of 2.74% in February. First falling to 2.38% in March, then down to 2.20% in April, and finally 1.87% in May. Although Inflation has fallen it is still slightly above its 12 month moving average (Red Line) indicating that the short-term trend is still up, although the gap is closing, a cross below the moving average would indicate that the short term trend has switched to "down". Since 2008, there has been a battle between inflation and deflation with the FED fighting against deflation. In March, the FED has switched sides and is raising interest rates. … [Read more...]
Effects of Inflation on Businesses
When we think of inflation we usually think of how it affects us as consumers. But the effects of inflation are wide ranging, including not only individuals but also businesses and even countries. Consumers and businesses alike have to deal with the impact of inflation, both good and bad. Here are some ways in which inflation affects businesses: 1. Consumer Purchasing This is the most obvious impact to businesses. Rapidly rising prices will cause consumers to (as Samuel Goldwyn famously said) "stay away in droves". There are ways for businesses to plan for inflation to reduce the chances of revenue loss. Gradually increasing prices will prevent a sudden price hike, and if your … [Read more...]
March Inflation: Can 2 Wrongs Make a Right?
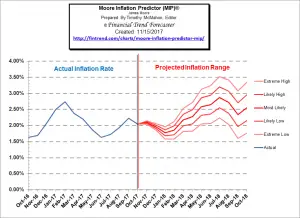
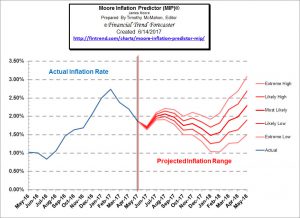
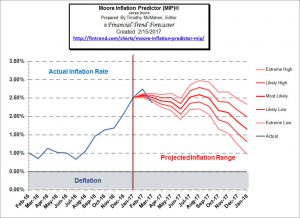
Back in February (based on January data) our Moore Inflation Predictor (MIP) forecast that March's inflation rate would be between 2.41% and 2.63% and today the Bureau of Labor Statistics said that March's annual inflation rate was 2.38%. So we were pretty close but how we got here is another matter entirely. In this case, two wrongs actually did make a right. As you can see from the chart below (we added a reality line to show what actually happened) first the inflation rate shot way above our projection and then it shot slightly below like some sort of drunk driver over-compensating while trying desperately to stay on the road. You can see what our MIP is projecting now … [Read more...]
Inflation Reaches Highest Level in 5 Years
On Wednesday March 15th the U.S. Bureau of Labor Statistics (BLS) released their monthly Inflation report for the 12 months ending February 28th . The Consumer Price Index (CPI-U) came in at 243.603 up from 242.839 in January. This resulted in a 0.31% monthly inflation and 2.74% annual inflation. The last time the annual inflation rate was this high was in February of 2012 when it was 2.87%. After a deflationary period from March through October 2009, massive quantitative easing, caused a 2 month flirtation with inflation nearing 3% but then inflation promptly fell and by June 2010 inflation was 1.05% again. The inflation rate spent the next several months bouncing around between 1% and … [Read more...]

