
The U.S. Bureau of Labor Statistics released the Annual Inflation Rate data for the year through the end of October on November 15th 2017.
- Annual inflation was 2.04% in October down from 2.23% in September.
- CPI-U 246.663
- Monthly Inflation for October -0.06%
- Next release December 13th
Monthly Inflation is Negative
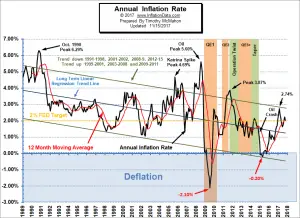 Whenever the monthly inflation rate is negative that is called “disinflation” i.e. prices have gone down since the previous month. If the annual inflation rate is negative that is called “deflation“. In October we had disinflation as prices fell slightly (but not below year ago levels). The CPI-U index fell from 246.819 in September to 246.663 in October. Typically the months of October through December produce the lowest increase in prices and are often even disinflationary and that is precisely what we got for October. Monthly inflation (on a non-adjusted basis) fell -0.06% in October 2017 compared to rising 0.125% in October 2016. That difference allowed the annual inflation rate to fall from 2.23% in September to 2.04% in October.
See Annual Inflation Chart for more info.
According to the U.S. Bureau of Labor Statistics (BLS) commissioner’s report-
“The Consumer Price Index for All Urban Consumers (CPI-U) rose 0.1 percent in October on a seasonally adjusted basis, the U.S. Bureau of Labor Statistics reported today. Over the last 12 months, the all items index rose 2.0 percent. The shelter index increased 0.3 percent and was the main factor in the seasonally adjusted all items increase. The energy index fell, as a decline in the gasoline index outweighed increases in other energy component indexes. The food index was unchanged over the month.”
Ways Inflation Affects the Real Estate Market
 Inflation from January 2007 through December 2016 was extremely low, averaging only 1.77% per year in the U.S. and 2009 was actually negative. Although 2017 has seen a bit more inflation it is still low by historical standards. In times of low inflation, inflation is a vague term that economists throw around when they’re trying to make one point or another. However, when inflation begins rising and hitting your pocket, the reality begins to set in. And it can have a quite noticeable effect on not only the goods you buy at your favorite big box store, but even on real estate. Let’s take a quick look at some ways rising (or sinking) prices get their tentacles into that new house being built or the one for sale down the street.
[Read More…]
Ways Inflation Affects the Real Estate Market Part 2.
In Part 1 of this series on Real Estate and Inflation, we discussed how monetary inflation creates price inflation which affects materials costs, creates a shift into rentals and a surge in foreclosures. But on the flip side, being a commodity itself, home ownership can provide protection against inflation and through the use of a mortgage allows you to pay off an appreciating asset with depreciating dollars.
This time we will look at a few more effects of Inflation on the average home buyer.
Misery Index
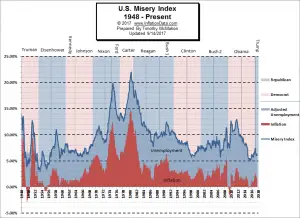 The misery index as of November 2017 (based on the most recent official government data for the 12 months ending in October) is at 6.14% (4.1% unemployment and 2.04% inflation) down from 6.43% in September but slightly above the 6.03% in June and July. With inflation and unemployment down slightly for the month, the Misery index is well below the February peak of 7.44%.[Read More…]
Moore Inflation Predictor
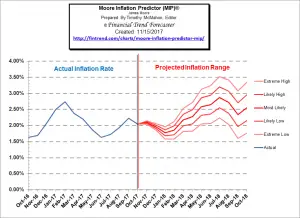 Last month our MIP Chart was projecting a sharp decline with an extreme high for October of 2.05% and we got 2.04%. This month, the MIP is projecting a flat to up move taking the Annual inflation rate up slightly for the month but then falling again through January or February.
See Moore Inflation Forecast for more info.
NYSE Rate of Change (ROC)©
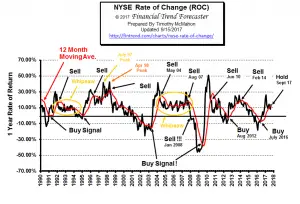 The NYSE Rate of Change (ROC) chart is helpful in getting the “big picture” of the stock market very quickly. The old saying “a picture is worth a thousand words” is very applicable to this chart. Once you understand how to read the ROC chart you can easily spot the direction of the market which makes it easy for you to know whether you want to be invested in the market or not. This month the NYSE ROC has fallen down below its moving average.
See what the falling NYSE ROC means for you now.
NASDAQ Rate of Change (ROC)©
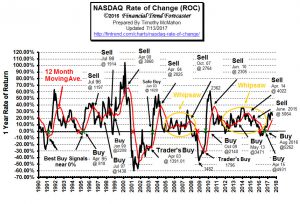
Annual returns are still above 27% in the NASDAQ and unlike the NYSE
the NASDAQ never fell below the line. …
See NASDAQ ROC for more.
You Might Also Like:
From Financial Trend Forecaster
- The 5 Countries That Could Push Oil Prices Up
- Catalan: Independence or Revolution?
- Stocks Still Have Strong Low-Inflation/Low-Rates/Improving-Economy Tailwind
- Bitcoin Trends
- The “Amazon Effect” Is Coming To Oil Markets
- Bulls, Bears and Fed Bond Purchases
- Gold Production
From Unemployment Data
- October Unemployment Rate Down Again
- What You Can do When Your Unemployment Benefits are Denied
- 5 Ways a DUI Can Affect Potential Employment
- How to Handle Getting Laid-Off Without Warning
- Medical Personnel Shortage: How This Vacuum Will Impact the Careers of Health Professionals
From OptioMoney
- Debt Diversions: Why Staying Away from Pay-Day Loans is Crucial
- Wealth Transfer: How to Ensure Your Will is Ready to Execute
- Home Buying 101: 4 Signs to Look for When Choosing a Mortgage Lender
- 3 Things You Need to Know About Jumbo Loans
- Crash and Burn: How to Handle the Lost Wages after a Car Accident
From Elliott Wave University
- U.S. Stocks: A Sentiment Extreme You MUST Pay Attention to
- 12 Real-Life Techniques That Will Make You a Better Trader Now
- Did You See the 30% Rise in This Major Global Stock Index?
- Silver Chart of the Day
- Gold: Often, Simple Forecasting Tools Are All You Need
From Your Family Finances
- Affordable Accents: Renovating Your Home on a Dime
- Budget Bash: Throw Your Holiday Parties for Less
- How Young Families Can Move Past the Living Paycheck-to-Paycheck Phase
- 5 Facts that Demystify Selling a Large Home
- How Much Do You Know About Life Insurance?

Leave a Reply