Back in February (based on January data) our Moore Inflation Predictor (MIP) forecast that March’s inflation rate would be between 2.41% and 2.63% and today the Bureau of Labor Statistics said that March’s annual inflation rate was 2.38%. So we were pretty close but how we got here is another matter entirely. In this case, two wrongs actually did make a right. As you can see from the chart below (we added a reality line to show what actually happened) first the inflation rate shot way above our projection and then it shot slightly below like some sort of drunk driver over-compensating while trying desperately to stay on the road.
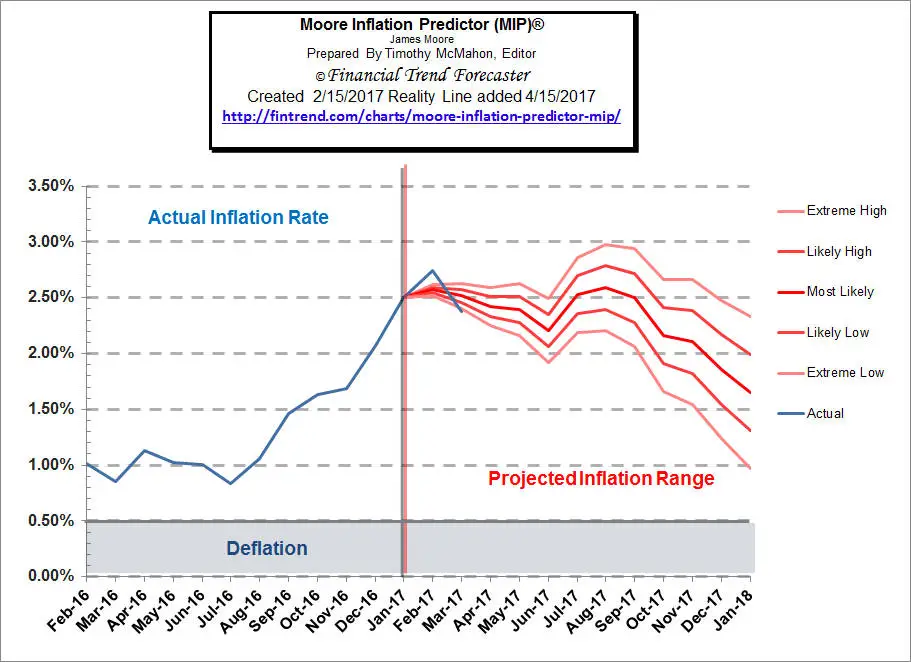
You can see what our MIP is projecting now here.
Current BLS Inflation Numbers
The Bureau of Labor Statistics (BLS) released the inflation numbers for the month of March on Friday April 14th. The Consumer Price Index (CPI-U) was 243.801 up from 243.603 in February resulting in 2.38% annual inflation. If we compare March 2016’s cpi index which was (238.132) with March 2017 (243.801) we can see a 5.669 point increase in the 12 month period. 5.669 / 238.132= 0.023806 which when rounded to 2 decimal places equals 2.38% annual inflation.
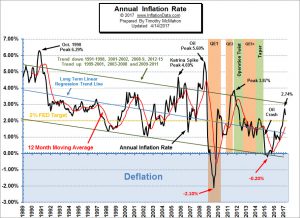 Annual Inflation Chart
Monthly inflation for March came in at 0.08%, which is very low for a month in the typically high inflation first quarter of the year. Last year January and February were very low but came in much more typical in 2017 thus driving the annual inflation rate up, while March did the exact opposite and brought annual inflation back down a bit…
Although Inflation has fallen it is still above its 12 month moving average (Red Line) indicating that the short-term trend is up, a cross below the moving average would change that. Read More …
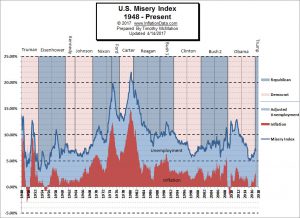 Misery Index 2017
The misery index as of April 2017 (based on the most recent official government data for the 12 months ending in March) is at 6.88% (4.5% unemployment and 2.38% inflation) down from last month’s 7.44% and well below the peak of 12.87% in both October and November 2011 which was pretty miserable. With inflation and unemployment down for the month, the Misery index is down 0.56% in one month. The average inflation rate since the beginning of the Misery Index in January 1948 is 3.55% which is 0.81% higher than current inflation levels… so if inflation were “average” the misery index would be higher.
 America & Money: Cool Facts About the History of Our Monetary System
Since 1776, many things have changed dramatically in America. One of the most drastic series of changes has been in the way we conduct transactions using money. There were three general types of money in the colonies: specie (i.e coins made of precious metals), paper money and commodity money…
The first coinage act was not passed until April 2, 1792, (almost 16 years after the Declaration of Independence), prior to that the Colonies did not mint their own coins and …
Bills of credit were issued by individual colonies to pay government debts. In other words, the local government would buy things by issuing I.O.U’s and then you could trade them with other people until someone eventually used them to pay their taxes …
Pennsylvania was unique in that it did not issue more currency than it could redeem and it remains one of the few examples in history of a successful government-managed monetary system… [Read More…]
The U.S. Economy, Payrolls & FOMC
In today’s post Gary Tanashian looks at ten charts and indicators to give us a unique look at the trends of the overall economic situation, the state of the “economic recovery” and the employment … [Read More…]
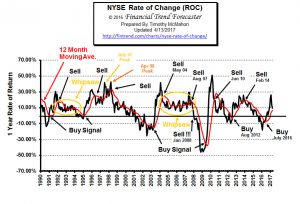 Current NYSE-ROC Analysis:
Hold Signal! Index nears Moving Average.
A buy signal was generated in July 2016. We are now switching to a HOLD signal as the ROC has peaked and nears its moving average.
This month the monthly rate of return was negative down from 0.53% last month. The annual rate of return fell from 13.64% last month to 9.32% this month. This gives us a peak after shooting up from below zero so we would expect it to drop through the moving average shortly. See NYSE Rate of Change Chart
See Also NASDAQ Rate of Change Chart
You might also like:
- The U.S. Economy, Payrolls & FOMC
- Is a Second OPEC Cut In The Cards?
- Are Oil Production Costs Rising or Falling?
- Cryptocurrency: Is Bitcoin the Future of Money?
- Gold Prices Inching Higher
- The Oil War Just Getting Started
- How Much Has Inflation Affected Mortgage Rates in the Last 5 Years?
- Ways to Make a Happier Blue-Collar Workforce
- The Most Outsourced Jobs in 2017
- Unemployment Down in March
- Housing Ace: 5 Ways to Prepare for a Job in Real Estate
- Credit Cards Out of Control? 3 Ways to Get You Back on Your Feet
- More Than a Price Tag: How to Calculate the Overall Cost of Buying a Home
- 4 Tips For Finding Deals On Everyday Necessities
- Sprucing Up Your Yard On A Budget (Video)
- Energy Finances 101: How to Decrease Your Bills By 10 Percent or More!
- Credit Suisse & UBS have a Message for Wealthy Clients
- Will Stocks Finally Break out of the 35 Year Box?
- US Drives Global Growth
- Six Tax Break Tricks for New Homeowners
- Improve Your Terms: 3 Tips To Figuring Out Home Refinancing
- Ideas to Improve Your Money Management Skills
- Putting Precious Metals in Your IRA
- 5 Ways to Take Real Estate Investment to the Next Level


Leave a Reply