
We have written quite extensively on the cause of inflation in articles like: How does the Money Supply affect our Inflation Rate? in What is Inflation? and Inflation Cause and Effects. One of the keys to understanding inflation is the Money Multiplier. Because of the “Fractional Reserve system banks are only required to keep a small fraction of the money on deposit as “reserves” against potential withdrawals the bank can loan out the majority of the money on deposit to earn interest. This results in a multiplication effect increasing the money supply by vast multiples. This “leverage” can work in either direction.
In April 2010, I wrote an article explaining how this can result in deflation called Velocity of Money and Money Multiplier – Why Deflation Is Possible. And although the FED was actively trying to pump up the money supply through things like Quantitative Easing we still experienced some annual deflation and quite a bit of disinflation. In the following article by Elliott Wave International we are going to look further at the Quantity Theory of Money. At the end I will discuss a bit more about the Velocity of money.~ Tim McMahon, editor.
Deflation Basics Series: The Quantity Theory of Money
By Elliott Wave International
Here’s our challenge.
In order to be aware of the investment pitfalls and opportunities that deflation can bring, we must first understand the basic elements of why it occurs. So our challenge is to try and make monetary economics, a subject that most people would find duller than watching paint dry on a wall, understandable and, dare I say it, fun! It’s a big ask but we like a test, and so here is the first in our Deflation Basics Series — The Quantity Theory of Money.
The Quantity Theory of Money (QTM for short) is the very essence of the true definition of inflation and deflation. You see, most people think of inflation and deflation as the rise and fall of prices when it is actually all about the rise and fall of the quantity of money.
The QTM has its origins in the 16th century and the writings of the Prussian polymath Nicolaus Copernicus as well as followers of the School of Salamanca such as Martín de Azpilcueta. As European nations looted the Americas for gold and silver, an increase in the price of goods in general was noted as the metals were brought back to the Old World. This observation, via the writings of, among others, John Locke, David Hume, John Stuart Mill and Ludwig von Mises, led to a link between the quantity of money in an economy and the level of the price of goods.
QTM is the cornerstone of monetarist economics which was largely developed by Milton Friedman, gaining popularity during the 1970s. Put simply, the Quantity Theory of Money can be expressed as the “Equation of Exchange”:
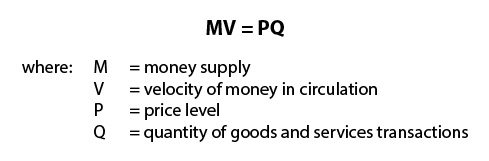
In plain speak, the amount of money in an economy multiplied by the number of times that money is used, equals the price of stuff bought multiplied by the amount of stuff bought.
Let’s take a simple example.
If an economy has $1,000 in total and that money is turned over 3 times during a month, total spending equals $3,000 that month. If the amount of stuff bought was 100 items, then the average price of each item would be $3,000 divided by 100 which equals $30.

We can re-arrange the Equation of Exchange to solve for the price level, P:

Therefore, in our economy:

Now let’s assume that, the next month, money supply increases from $1,000 to $2,000, with the velocity of money and the amount of stuff bought staying the same. What would be the effect on the average price level?

The average price level has gone up from $30 to $60. The average price of goods has gone up due to the inflation of the money supply.
The next month, the money supply decreases from $2,000 to $500, with the velocity of money and the amount of stuff bought staying the same. What would be the effect on the average price level now?

The average price level has gone down from $60 to $15. The average price of goods has gone down due to the deflation of the money supply.
This basic example shows the relationship between the level of the money supply in an economy and the average level of prices. The catch comes, of course, with the old economics chestnut, the Latin phrase ceteris paribus (all other things being equal). In the ivory towers of academic economics all other things can remain equal, but in the real world, they don’t.
So our assumptions in the example above that the velocity of money remained at 3 and that the amount of stuff bought remained at 100 would have to be challenged. In fact, one of the main criticisms of the QTM is that the velocity of money does not remain constant and changes due to the vagaries of spending impulses. However, if money supply didn’t change but the velocity of money went down instead, the effect is the same — lower prices (assuming the amount of stuff bought remained the same that is!).
Monetarists in the 1980s thought that, by targeting money supply growth, the level of goods and service prices in an economy could be controlled. However, although there is a link between the general level of prices in an economy and the amount of money, it is not rigid, and prices can move up and down for a myriad of reasons.
Nevertheless, the general relationship in the Quantity Theory of Money stands. More money in an economy (inflation) tends to lead to higher prices and less money (deflation) tends to lead to lower prices.
Notes from the Editor:
The above article mentions the Velocity of Money so let’s look at that in a bit more detail. In times of inflation (or even just the perception of potential inflation) everyone wants to spend their money before it becomes worthless… you can think of it like a giant game of “hot potato” where money is the potato. Let’s see what happens if “V” changes.
Above we saw that if M doubles prices will double. Since the basic formula is M times V, in the same way if V doubles prices will also double. But that is not what has been happening. Quite the opposite. In the chart below we can see “V” rose dramatically from 1990 through 1995 but it fell from 2000 – 2003, then rebounded a bit into 2005 and has been falling pretty much ever since.
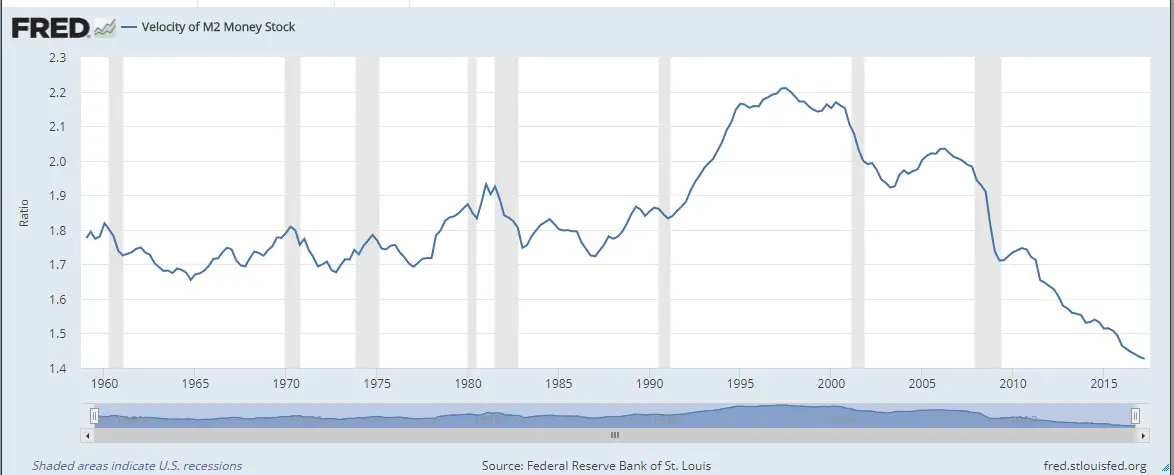
Data Source: Federal Reserve Bank of St. Louis, Velocity of M2 Money Stock [M2V], retrieved from FRED, Federal Reserve Bank of St. Louis; October 20, 2017.
So despite massive increases in the money supply due to quantitative easing, there hasn’t been massive inflation and in fact we have seen some deflation because the money hasn’t been turning over. If people think money will become more valuable (deflation) or if they think it will be harder to come by, due to unemployment, falling stock market, etc. they will hang on to it longer i.e. reduce the velocity of money. And that has been happening since the peak in 2007 so inflation has been tame and deflation becomes a real possibility. ~Tim McMahon, editor.
What You Need to Know NOW About Protecting Yourself from DeflationThe best way to protect yourself from deflation is to first understand what it is. In this free, special report, you’ll learn about this unexpected risk and what it can do to your portfolio. You’ll also get 29 specific forecasts for stocks, real estate, gold and new cultural trends, to help you prepare and protect your wealth. |
Your Bond Fund: It’s Riskier Than You ThinkQuantitative Easing (QE) changed the bond markets in ways many don’t realize. And now that QE is unwinding, investing in bonds comes with pitfalls that are too risky to overlook. This new resource from EWI’s Murray Gunn offers insights you don’t want to miss. Get your free report, Your Bond Fund: It’s Riskier Than You Think. |
This article was syndicated by Elliott Wave International and was originally published under the headline Deflation Basics Series: The Quantity Theory of Money. EWI is the world’s largest market forecasting firm. Its staff of full-time analysts led by Chartered Market Technician Robert Prechter provides 24-hour-a-day market analysis to institutional and private investors around the world.

Leave a Reply