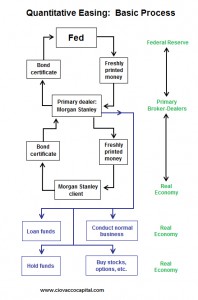
Yesterday we looked at the process the FED uses to get the money "Out of Thin Air" and into the hands of people who can spend it. In other words the "how" they do this magic. Basically, that route is through special dealers and then it goes into a few select hands. Today we are not going to look at the "how" but instead we will look at "Who" gets the money and where it is likely to go from there. Because if we know where it is likely to go we can get there first and profit from the incoming cash flow. ~Tim McMahon, editor Quantitative Easing (QE2): Who Gets the Fed’s Printed Money? Part 2 of a 6 Part Video Series on Quantitative Easing: In Part 1: How the FED Prints Money, we … [Read more...]
How the FED Prints Money
Printing Money: The process of "printing" money is always a kind of mystery to most people since only about 10% of the total money supply is actually in physical currency. Technically most of the money isn't printed so the term should be "money creation" or "money supply expansion" but "printing money" is used euphemistically to include all forms of expanding the money supply. The monetary base (or money supply) is typically controlled by adjusting monetary policy. This is usually done by the central bank (in the U.S. this is the Federal Reserve Bank or FED). The FED changes the monetary base through "open market transactions" (i.e., buying and selling of government bonds). The FED also … [Read more...]
Annual Inflation Since 1914
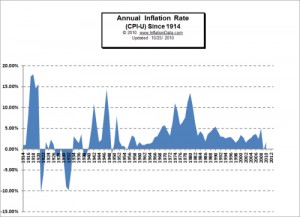
The Bureau of Labor Statistics has been tracking the Consumer Price Index (CPI-U) since 1913. Thus they have been able to calculate the Inflation rate since 1914. And over that period we have seen some major periods of both inflation and deflation as you can see from the chart. The early years (the teens) were marked by high inflation. The early 1920's started with deflation and low inflation. The 1930's of course had the Great Depression and was primarily a period of deflation. World War II ushered in times of massive government spending and nationwide austerity as commodities were rationed and most of the production was directed toward the war effort. As the G.I.s returned and wanted to … [Read more...]
M3 Money Supply Numbers are Back- Sort Of
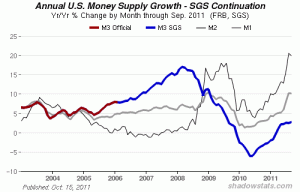
Back in March of 2006 I told you the U.S. Government was hiding something and that something was the growth in the money supply as measured by M3. Back then the Federal Reserve tracked and published the money supply measured three different ways-- M1, M2, and M3. Each of these three money supply measures track slightly different views of the money supply. The most restrictive, M1, only measures the most liquid forms of money; it is limited to currency actually in the hands of the public. This includes checking accounts travelers checks, and other deposits against which checks can be written. Of course the money supply is much bigger than that. What about savings accounts? M2 … [Read more...]
Casey Gold Summit Offers Investment Nuggets
Source: Diane Fraser of The Gold Report 10/13/2010 Carlsbad is several hundred miles south of Sutter's Mill, but the experts and investors who gathered for Casey Research's recent Gold Summit were just as enthusiastic about the precious metal as the prospectors who headed into the hills back in 1849. The Gold Report took the opportunity to speak with some of the many experts on hand. For three days, the leading experts in the resource investment sector gathered with investors to discuss the investment strategies. Doug Casey, Richard Russell, Ross Beaty, Eric Sprott, Ian McAvity, Rick Rule, Robert Prechter and Bob Quartermain all gave their varied impressions on the market and their … [Read more...]
Casey Research Identifies Next Generation of Resource Leaders with Casey’s NexTen
Stowe, VT, October 12, 2010 – Casey Research, a leader in providing in-depth, independent analysis of high-growth investment opportunities, announced today Casey’s NextTen, the next generation of leaders in the natural resource industry. Successful investors, like Casey Research founder Doug Casey, have long recognized that there are no more important considerations when investing than the people. For years, Casey Research has helped its subscribers succeed by closely following the careers of the most successful explorers in the industry, those top few percent who consistently generate the majority of returns for shareholders. And now, it is proud to present the next generation of … [Read more...]
Get Your Free Report: How to Use Bar Patterns to Spot Trade Setups
Greetings reader, Our friends at Elliott Wave International, the world’s largest market forecasting firm, have just updated their free report, How to Use Bar Patterns to Spot Trade Setups. With thousands of downloads, “Bar Patterns” has always been a huge hit with traders. But now it’s been packed with even more ways you can use common bar patterns to spot high-probability trading opportunities: 30 charts across 15 pages! Don’t miss out on this opportunity to learn simple new ways to spot valuable trade setups in the charts you view every day. Download Your Free Bar Patterns Report. … [Read more...]
Inflation in the U.S. vs. Japan
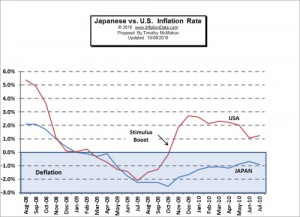
The end of 2008 was a massive disinflationary period as the inflation rate fell from lofty heights until in January 2009 the inflation rate had fallen in both the U.S. and Japan to about zero. Deflation followed as the rate fell below the zero line through July. But then the two countries started diverging as the massive trillion dollar bailout began kicking in in the U.S. It kicked the U.S. inflation rate up to almost three percent before petering out. The inflation rate stayed negative (deflationary) in Japan however as prices continued to fall by 1% to 2% per year, which is probably where the U.S. would have been without the trillion dollar stimulus. Inflation in the U.S. currently … [Read more...]
OECD Annual Inflation Rate Steady at 1.6% in August 2010
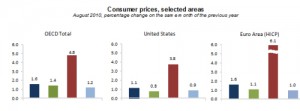
It takes a bit longer to compile the inflation information for a variety of countries so we are just getting information for August from the Organisation for Economic Co-operation and Development (OECD) for their member countries. Consumer prices in the OECD area rose by 1.6% in the year to August 2010, the same inflation rate as in July. Growth in energy prices slowed to 4.8% in August compared with 6.2% in July, while consumer prices for food rose by 1.4% compared with 1.1% in July. Excluding food and energy, the annual inflation rate held steady at 1.2 % in the year to August 2010. To calculate the U.S. inflation rate between any two dates use our Inflation Calculator. … [Read more...]
Pressures Mount on Bank of England (BOE) to Devalue Pound
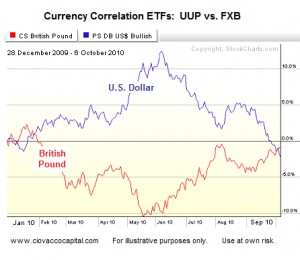
October 7, 2010 By Chris Ciovacco The Bank of England (BOE) is due to make a statement today at noon in London (7:00 a.m. ET U.S.). The BOE’s actions in the next 45 days may be important to investors in the U.S. and global commodity markets. All things being equal, a weak U.S. dollar tends to provide favorable headwinds to both U.S. stocks and commodities, such as oil (USL), copper (JJC), gold (GLD), and silver (SLV). With the BOE facing more bad news on the housing front today, political pressures to join the money-printing parties in the United States and Japan are mounting. As shown below, the U.S. Dollar (UUP) and British Pound (FXB) tend to be negatively correlated. Should the … [Read more...]

