
Earlier this month, the internet was flooded with reports, stating that the “50-year petrodollar agreement” between the United States and Saudi Arabia had expired and that the petrodollar was now dead. Over the years we've written on the PetroDollar on several occasions. But this time, just as in the case of Mark Twain, "the Death of the PetroDollar has been greatly exaggerated". Ten years ago, we published an article entitled Oil, Petrodollars and Gold. In that article, I showed how the demonetizing of gold eventually led to Henry Kissinger making a deal in 1973 with Saudi Arabia to denominate all their oil sales in U.S. Dollars in exchange for the Kingdom receiving U.S. military … [Read more...]
May Inflation Surprisingly Mild
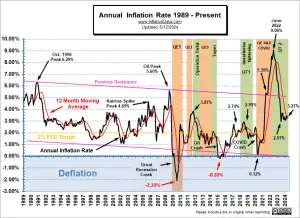
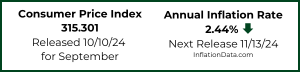
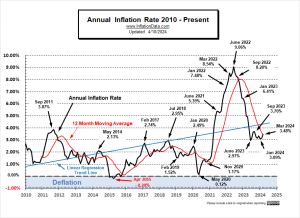
The U.S. Bureau of Labor Statistics released its May Inflation report on June 12th showing Annual Inflation was down from 3.4% in April to 3.3% in May. (But since we calculate it to two digits, it was actually 3.36% in April and 3.27% in May.) On a Seasonally adjusted basis, monthly inflation in May was ZERO. Bloomberg is making a big deal about that, but what does it really mean? As, I've been saying, beginning in the May-June timeframe inflation typically moderates for the Summer months and then gets really low (or even negative) in the 4th quarter. And that is what is happening. Double Whammy Day The overnight markets were down expecting more inflation so when the report was released … [Read more...]
If Trump Won the 2020 Election Would Inflation Be Lower?
I recently saw this question on Quora and thought it was interesting. It made me think. Does the President control inflation? My first thought was that inflation is controlled by the FED printing money or perhaps by Congress spending money, but how much difference does the President make? Then I read the following response by Valerie Rhea who graciously gave me permission to reprint her response here. Valerie is a Thirty-something PhD economist, and former military pilot, with a law degree. So, she has an interesting background and is well qualified to answer this question. Here is her response. ~ Tim McMahon, editor Inflation is always and everywhere a monetary issue" If … [Read more...]
How Social Security Tax and Inflation Affect Couples’ Retirement

Planning for retirement is an essential part of couples' financial management. As life expectancy increases and healthcare costs rise, ensuring that you have sufficient funds to maintain your lifestyle during retirement has become more critical than ever. Two major factors that can significantly impact retirement income are Social Security tax and inflation. Many people don't realize that Social Security income can be taxable, (which doesn't seem right since Social Security was a "tax" from your income to start with). Understanding how these elements affect your financial future can help you make more informed decisions and better prepare for the years ahead. What is Social Security … [Read more...]
Inflation Destroys More Than Money
Everyone knows that inflation hurts consumers by raising the cost of their purchases and that it hurts those on fixed incomes the most because although their costs are rising, their income isn't. In addition to impoverishing individuals, inflation has several less obvious ramifications. Perhaps the most insidious and detrimental consequence of inflation is the facilitation of more wars. How Inflation Promotes War Prior to the advent of fiat currencies, if a Monarch wanted to wage war, he had to figure out a way to pay for it. If his treasury wasn't large enough to pay for the means of war, the king would have to either raise taxes, or borrow the money, either way there were limits to how … [Read more...]
How Inflation Is Reshaping the Job Market for New Entrants

As you enter the workforce, there are myriad challenges and strategies to navigate — particularly around finding a job in the first place. Inflation rates only complicate this intricate dance you are doing to land a career as a recent graduate or new professional on the scene. Whether you’re sure or unsure about your career path, there are plenty of opportunities to be found in the current job market. Although the rate of rising prices changes things a bit, there are ways to be savvy about the system and land the job of your dreams. The Current State of Inflation and Wages There always seems to be a debate over whether or not wages are keeping up with inflation. However, it’s not always a … [Read more...]
April Inflation Sparks Market

The U.S. Bureau of Labor Statistics released its April Inflation report on May 15th showing Annual Inflation was down from 3.5% in March to 3.4% in April. (but since we calculate it to two digits, it was actually 3.48% in March and 3.36% in April.) The markets took this as a good sign and the NYSE rallied 157.68 points resulting in a 0.87% gain. The NASDAQ did even better gaining 231.21 points or 1.40%. Prior to the gain, our NASDAQ ROC was flashing a warning signal. But we did say that we needed to wait for confirmation before selling. Unadjusted monthly inflation was 0.65% in March which moderated sharply to "only" 0.39% in April. Typically inflation is highest in the first … [Read more...]
4 Key Factors to Consider When Hedging Against Inflation

The FED's target yearly inflation rate in the U.S. is about 2%, but the long term average is more like 3% and depending on ongoing economic conditions, this rate can significantly increase, affecting the financial health of individuals across the country. Though keeping an eye on the economy can help you make decisions to brace against the impact of inflation, developing sound investments can help you protect your wealth no matter the rate. Take a look below for a few central items to consider when preserving your finances against inflation. Diversify your Portfolio Portfolio diversification is crucial for maintaining optimal financial health. Your investments should vary in asset class … [Read more...]
Navigating Economic Turbulence: How Inflationary Pressures Drive Payment Fraud Trends

This article is a bit beyond the scope of our typical article but is presented for those who want to delve into the murky waters of this issue. For a lighter look at scams and modern solutions, you might enjoy The Modern Day Wild West: Crypto Scams And Opportunities. ~Tim McMahon, editor. In an era of perpetually shifting economic landscapes, it is important for businesses and consumers alike to understand the nuances of inflationary pressures. As inflation distorts purchasing power, various vulnerabilities emerge and so fraudsters can exploit the emerging vulnerabilities, leading to sophisticated scams. Navigating these turbulent waters requires a keen understanding of the evolving … [Read more...]
March Inflation Causes Market Concern
The U.S. Bureau of Labor Statistics CPI report released on April 10th, showed Annual Inflation was up from 3.2% in February to 3.5% in March. (but since we calculate it to two digits, it was actually 3.15% in February and 3.48% in March.) Monthly inflation was 0.62% in February and 0.65% in March. Typically inflation is highest in the first quarter of the year, so these numbers are a bit high but not that unusual. In March 2023 monthly inflation was 0.33%, so annual inflation jumped in 2024. Mr. Market didn't like the news because it drastically reduced the chances of a rate cut anytime soon. So, stocks fell on the release. The NYSE opened at 18,171.20 and that was the high for the … [Read more...]
