
Inflation presents significant financial challenges for retirees living on fixed incomes, as rising costs strain budgets. Although Social Security has a Cost of Living Adjustment (COLA) built in, Social Security was never meant to be your only source of income after retirement, but rather it was intended to supplement your other retirement income. This article will explore key areas most affected by inflation, such as food, energy, healthcare, and discretionary spending, and provide practical tips to help you adapt. For those planning to retire in 2024 or the next few years, identifying and managing everyday expenses is more important than ever to maintain financial stability. #1 Keeping … [Read more...]
2025 Social Security COLA

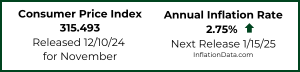
With inflation trending down, the Federal Cost of Living Adjustment- (COLA) will be smaller in 2025 than in 2024. For 2024, the increase was 3.2% but beginning in January 2025 Social Security will get a smaller 2.5% increase. Although the most commonly quoted inflation statistic is the Consumer Price Index for All Urban Consumers (CPI-U) for some reason the government chooses to use the October print of the CPI-W (Consumer Price Index for Urban Wage Earners and Clerical Workers) instead. Cynics say it was chosen because it tends to be about 1/10th percent lower than the CPI-U. In 2023, when inflation was much higher, Social Security received an 8.7% COLA. In 2022, the COLA was 5.9%. And … [Read more...]
October 2024 Inflation Up Slightly
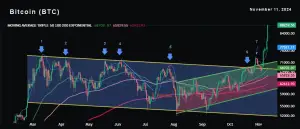
The U.S. Bureau of Labor Statistics released its October Inflation report on Wednesday November 13th showing Annual Inflation was up from 2.4% in September to 2.6% in October. (But since we calculate it to two digits, it was actually 2.44% in September and 2.60% in October.) On a non-seasonally adjusted basis, monthly inflation in September was 0.16% and fell to 0.12% in October but annual inflation rose because October 2023 was negative at -0.04%. Gold Prices: As I've been saying for a long time, gold is more of an uncertainty (or crisis) hedge than an inflation hedge. And apparently, the U.S. Election settled a lot of uncertainty. Spot gold peaked at $2,790 at the end of October and … [Read more...]
Inflation-Proofing Your Family Budget
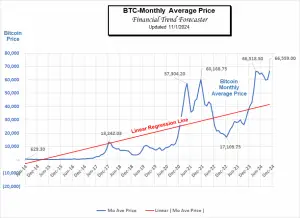
After a sustained period of post-COVID inflation, prices for household goods and food have begun to stabilize between two and three percent. However, if you happen to have dug out an old receipt from a pre-COVID food shop, you may be shocked to see how much more you pay for everyday items and ingredients. This is because the effects of inflation are cumulative and compounding. So, three consecutive years of 2% inflation results in more than 6% cumulative inflation and if you throw in one year of 9% inflation prices really soar. The rapid change in food prices is largely driven by a 2022 spike in inflation, which saw the average grocery bill rise by 9.9% in a single year. While a few … [Read more...]
September Inflation Falls
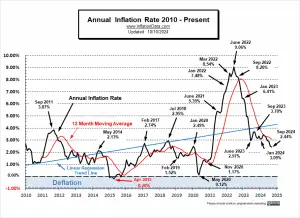
The U.S. Bureau of Labor Statistics released its September Inflation report on Wednesday October 10th showing Annual Inflation was down from 2.5% in August to 2.4% in September. (But since we calculate it to two digits, it was actually 2.53% in August and 2.44% in September.) On a non-seasonally adjusted basis, monthly inflation in August was 0.08% and it increased to 0.16% in September but that was still lower than last September's 0.25% so the annual inflation rate fell. Gold Prices: As you can see on the above hourly chart, Gold peaked just over $2680, late last month, shortly after we published the chart below saying that, "On an inflation-adjusted basis gold is near … [Read more...]
FED Interest Rates
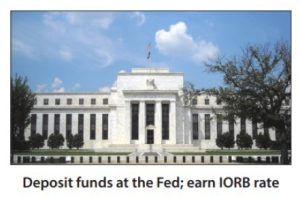
The Fed funds rate is, effectively, the price of money. When it changes, much like dropping a rock into the water, the impact ripples out in all directions.— Greg McBride, Bankrate Chief Financial Analyst On Wednesday, September 18th, the FED reduced interest rates for the first time in four years. Mr. Market has been anticipating this cut all year and it finally happened. Last month FED Chairman Powell hinted at a rate cut at this FOMC meeting and at the time most experts believed that the cut would only be 25 basis points or ¼%. But, once lower-than-expected August inflation numbers were released on September 11th, the market began clamoring for a 50 basis point cut, or even a 75 basis … [Read more...]
Gold Rallies on LOWER August Inflation?
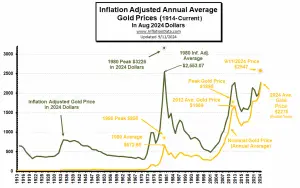
The U.S. Bureau of Labor Statistics released its August Inflation report on Wednesday September 11th showing Annual Inflation was down from 2.9% in July to 2.5% in August. (But since we calculate it to two digits, it was actually 2.89% in July and 2.53% in August.) On a non-seasonally adjusted basis, monthly inflation in July was 0.12% and 0.08% in August. Gold Prices: Contrary to what you might expect the day after the release of the lower inflation numbers Gold rallied to $2554 by mid-afternoon. I've often said, Gold is a crisis hedge NOT an inflation hedge. This is primarily because there is no "counterparty risk" i.e., it is strictly an asset not simultaneously someone else's … [Read more...]
Optimize Your Finances as Inflation Cools

The consumer price index, personal consumption expenditures, and producer price index point to cooling inflation, but no one can say for certain what the economy will do next. High inflation rates have a devastating effect on economies and the people within them, so a slower rate of inflation over the next few months and years could make everyone breathe a little easier. However, with so many factors up in the air — the U.S. presidential election and ongoing geopolitical conflicts, among others — you might not want to make any drastic moves with your personal finances. If inflation rates slow down and the economy returns to a more normal healthy state, you should adjust your financial … [Read more...]
July 2024 Annual Inflation Falls Again
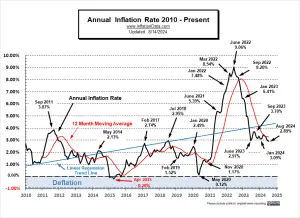
The U.S. Bureau of Labor Statistics released its July Inflation report on Wednesday August 14th showing Annual Inflation was down from 3% in June to 2.9%. (But since we calculate it to two digits, it was actually 2.97% in June and 2.89% in July.) On a non-seasonally adjusted basis, monthly inflation in June was 0.03% and 0.12% in July. So despite monthly inflation being slightly higher in July 2024 than in June, it was lower than July 2023 (@0.19%) so Annual Inflation fell. Economists had been predicting that the inflation rate would come in at 3.0% so inflation was lower than expectations, but Mr. Market didn't celebrate much (only increasing about 1/2%) but the rally continued upward on … [Read more...]
What Causes Stagflation?

In my article What is Stagflation, I wrote: The simple definition of Stagflation is a “stagnant economy coupled with price inflation”. Thus the term Stagflation… it has nothing to do with Deer. In other words, in stagflation prices are going up while the economy is going down. The word was coined during the inflationary period of the 1970’s. In the following article Frank Shostak goes into more depth on stagflation. ~ Tim McMahon, editor What is Stagflation? The occurrence of stagflation is associated with a situation of general strengthening in the momentum of prices while at the same time the pace of economic activity is declining. A famous stagflation episode occurred during the … [Read more...]
