

As you enter the workforce, there are myriad challenges and strategies to navigate — particularly around finding a job in the first place. Inflation rates only complicate this intricate dance you are doing to land a career as a recent graduate or new professional on the scene. Whether you’re sure or unsure about your career path, there are plenty of opportunities to be found in the current job market. Although the rate of rising prices changes things a bit, there are ways to be savvy about the system and land the job of your dreams. The Current State of Inflation and Wages There always seems to be a debate over whether or not wages are keeping up with inflation. However, it’s not always a … [Read more...]
Have Wages Kept Up with Inflation in 2023?
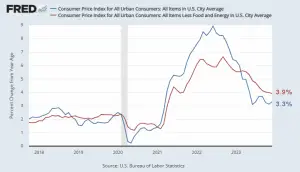
There seems to be a perennial debate about whether wages are keeping up with inflation. The media in particular loves to stoke this particular divide. We delved into this a bit in our article Not All Prices Have Inflated Since 1964 in which we showed that although wages in nominal terms haven't kept up for the "median" worker, but the "average" worker is doing better. This indicates that many workers are better off than in 1964, but not all (on a purely inflation-adjusted basis). Despite the numbers, purchasing power in many technology sectors has multiplied so many times and quality has increased so drastically that even though overall prices multiplied ten-fold, things like Televisions … [Read more...]
Gasoline Prices vs. Wages Over Time

Historical Gasoline Prices in Pictures-- I thought it would be fun to look at some pictures of gasoline prices in days gone by. Of course, we have to remember that salaries were much lower in those days as well. Inflation doesn't affect all prices equally. Let's look at how Gasoline Prices and Wages relate since the 1920s. In 1924 my grandfather probably paid around 21 cents a gallon for gasoline. The average wage was about 62.6¢/hour. But that was just the average, a unionized carpenter in Boston would have made a whole Dollar an hour. Imagine paying 15½ cents for a gallon of gasoline. Although we don't have an exact date for these pictures, we can estimate the … [Read more...]
Don’t Blame Putin for High U.S. Inflation… Yet
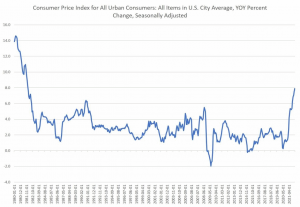
With Annual Inflation reaching 40-year highs in February, the current administration is frantically searching for a scapegoat... any scapegoat no matter how absurd... to deflect responsibility for the current high inflation rate. First, inflation was "transitory"... then when it was obvious it wasn't... it was supply chain disruptions, and when that narrative fell apart, along comes Putin... Well, inflation was a problem long before Putin invaded Ukraine. So although the "Putin Effect" might result in HIGHER inflation soon, it hasn't been the cause of inflation in the February 2022 inflation numbers. In today's article, Ryan McMaken looks at this issue. ~Tim McMahon, editor Price Inflation … [Read more...]
Price and Wage Changes since 2000
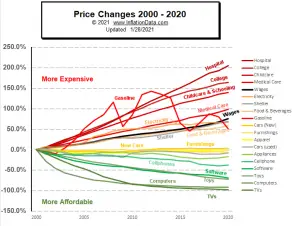
When we think about price changes we often think of them in terms of the changes in the Consumer Price Index (CPI-U for all Urban Consumers). Looking at it that way, we may get the idea that price movements are monolithic i.e. that they all move together, so "prices" were up 2% or 5% or whatever, over the last 12 months. But that is a bit misleading since prices all move independently. For this reason, the U.S. Bureau of Labor Statistics publishes a CPI database with a breakdown of all the various components. By analyzing the various components of the CPI over the last 20 years we developed the following Chart. Click Chart for larger image As we can see … [Read more...]
