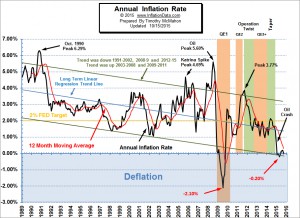
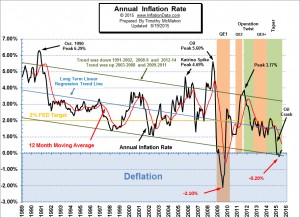
The Bureau of Labor Statistics (BLS) released their inflation numbers for the year ending September 30th on October 15, 2015. Monthly inflation was negative (disinflationary) for the second month in a row resulting in annual deflation of -0.04%. Although at this level the deflation is so slight that the BLS rounds it to Zero. So basically prices are on par with those of a year ago. However, that doesn't mean that all prices are identical to those of a year ago. In the report issued by the BLS yesterday we note that food prices are up 1.4% over a year ago while energy prices are down -18.4%. and all other items excluding food and energy are up 1.9% so we see that the primary cause of the … [Read more...]
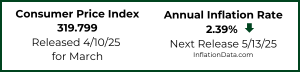
CPI Index Down but Annual Inflation Flat
The Bureau of Labor Statistics (BLS) released their monthly Consumer Price Index (CPI-U) and Inflation report for the year ending in August on September 16th. The CPI index fell slightly from 238.654 in July to 238.316 in August resulting in monthly deflation but Annual Inflation for the year ending in August was 0.20% up from 0.17% for the year ending in July. That means that something that cost $100 a year ago would cost $100.20 today. That is compared to the typical inflation of around 3% which would mean that something that cost $100 last year would cost $103 this year. The CPI-U index a year ago was 237.852 and is currently 238.316. On an Annual basis Energy fell 15.0% over the … [Read more...]
July Inflation Numbers Minimal
The Bureau of Labor Statistics (BLS) released their monthly Consumer Price Index (CPI-U) and Inflation report for the year ending in July on August 19th . Annual Inflation came in at 0.17%. That means that something that cost $100 a year ago would cost $100.17 today. That is compared to the typical inflation of around 3% which would mean that something that cost $100 last year would cost $103 this year. The BLS rounds this to .2% which of course is so small that almost any one of the deflationary months last year would cancel out all the inflation we've seen over the previous 12 months. The CPI-U index a year ago was 238.250 and is currently 238.654. We have seen significant … [Read more...]
June- First Annual Inflation for 2015
The Bureau of Labor Statistics (BLS) released their monthly Consumer Price Index (CPI-U) and Inflation report for the year ending in June on July 17th. This resulted in 0.12% Annual Inflation. The BLS rounded this to .1% which of course is so small that almost any one of the deflationary months last year would cancel out all the inflation we've seen over the previous 12 months. The CPI-U index a year ago was 238.343 and is currently an almost identical 238.638. January through May 2015 saw deflation on an annual basis although each month was inflationary in and of itself. But due to the massive deflation of the fourth quarter of 2014, all the monthly inflation was cancelled out. However, … [Read more...]
BLS Releases May Inflation Stats
May's monthly prices increase 0.51% but the annual inflation rate was still -0.04%. The Bureau of Labor Statistics (BLS) released their monthly Consumer Price Index (CPI-U) and Inflation report for the year ending in May on June 18th. This resulted in the 5th deflationary month in a row. We have seen a steady decline in inflation rates over the last year. May 2014 started with an annual inflation rate of 2.13%. June saw annual inflation fall to 2.07% then July declined to 1.99%, August was 1.70%, then September and October were both 1.66%, November was 1.32%, and December was 0.76%. When January rolled around it was … [Read more...]
Comparing the Cost of Living When Retiring (or Moving)
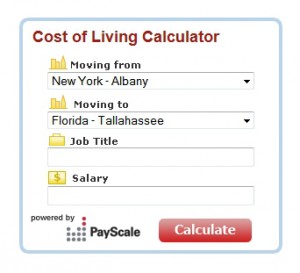
Most of us dream of the day we can retire and be free from the daily grind. Retirement offers us the opportunity to remake our lives and often we can choose to live almost anywhere. In years past that often meant moving to a a warmer climate like Florida or Arizona. One of the major considerations when choosing to relocate (whether for retirement or for a job) is the cost of living. Will your pension (or paycheck) cover your daily expenses? And that's where our Cost of Living Calculator comes in handy. It allows you to choose your starting location and your proposed destination and get a comparison between the two. For instance, suppose you are tired of the cold in Albany, N.Y. and … [Read more...]
April Ends Another Deflationary Year
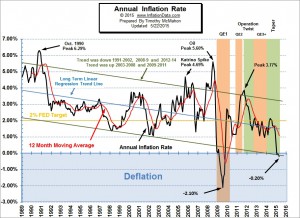
The Bureau of Labor Statistics (BLS) released their monthly Consumer Price Index (CPI-U) and Inflation report on May 22nd for the year ending in April. This resulted in the 4th month in a row where the numbers were negative (i.e. deflationary). Although the month of April itself saw prices increase 0.20% the net effect for the whole year was still -0.20%. We have seen a steady decline in inflation since May 2014 when it was 2.13%. The progression included June at 2.07% then July at 1.99%, August was 1.70%, then September and October were both 1.66%, November was 1.32%, December was 0.76% and then January was a deflationary -0.09%, February was -0.03%, March was -0.07% and finally April … [Read more...]
Deflation Again
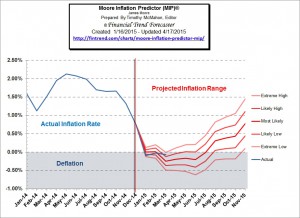
The Bureau of Labor Statistics (BLS) released the inflation statistics for the month of March on April 17th. Once again we have slight deflation on an Annual basis. The Consumer Price index (CPI-U) at the end of March 2015 was 236.119 while it was 236.293 at the end of March 2014. So overall prices are just a hair lower a full year later. That means there was -0.07% inflation and as we all know negative inflation on an annual basis is called Deflation. Because the BLS rounds all their results to one decimal place they have rounded it to -0.1% , which is what they said it was in January as well. Rounded to two places it is -0.09% for January, -0.03% for February and -0.07% for March which … [Read more...]
A Very Weak Economic Recovery
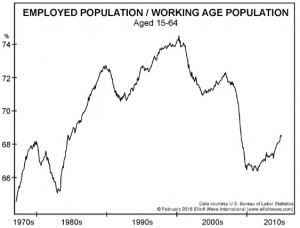
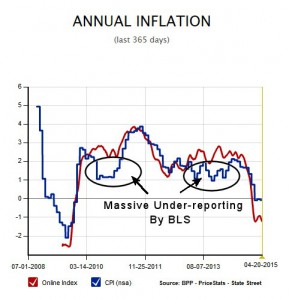
By Elliott Wave International Editor's note: The following article is excerpted from Elliott Wave International's new free report, "U.S. Economy Still on Life Support." For years, the government has manipulated its unemployment statistics to line up with its claim that the economy has recovered strongly. But that's not ALL the government is hiding from you. From foodstuffs, to crude oil prices, to GDP, the numbers and analysis reported by the government and mainstream financial press are misleading at best, downright falsehoods at worst. Get the hidden truth -- click here to read the full two-part report now >> For years, the government has been manipulating its unemployment … [Read more...]
Deflation Almost Zero
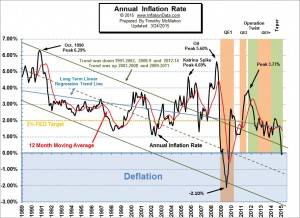
The Bureau of Labor Statistics (BLS) released the inflation statistics for the month of February on March 24th. According to the official numbers there was neither inflation nor deflation for the 12 months ending in February. Technically that wasn't exactly correct. The Consumer Price index (CPI-U) in February 2014 was 234.781 and in February 2015 it was 234.722. So actually there was -0.03% inflation and as we all know negative inflation on an annual basis is called "the big D" or Deflation. However, since the BLS rounds all their results to one decimal place they have rounded it to zero, that is prices are essentially the same as one year ago. Now before you send me nasty-grams saying … [Read more...]
