• Home
  • Related Sites
    • Financial Trend Forecaster
      • Moore Inflation Predictor
      • NYSE Rate of Change (ROC)
      • NASDAQ Rate of Change (ROC)
      • Crypto ROC- BTC & ETH
    • Unemployment Data
      • Historical Employment Data
      • Unemployment Rate Chart
      • Labor Force Participation Rate
    • Optio Money
    • Elliott Wave University
    • More Resources
  • Definitions
    • What is Inflation?
    • What is Core Inflation?
    • Inflation vs CPI
    • What is Deflation?
    • What is Disinflation?
    • What is Agflation?
    • What is Stagflation?
    • What is Hyperinflation?
    • What is Quantitative Easing?
    • What is Quantitative Tightening?
    • What is Velocity of Money?
    • What is Fiat Currency?
    • How Do I Calculate Inflation?
    • What are “Sticky Prices” and Why Do They Matter?
  • Featured Content
  • About Us
  • Feedback
    • Sitemap
  • Subscribe Now

InflationData.com

Your Place in Cyber Space for Inflation Data

CPI Index

CPIWidgetSept25
  • Numerical Inflation Data
    • Current Inflation Rate
    • Monthly Inflation Rate
    • Historical U.S. Inflation Rates
    • Historical CPI
  • Inflation Charts
    • Ann. Inf. Rate Chart
    • Long Term Inflation >
      • Ave. Inf. by Decade
      • Total Inf. by Decade
      • Inflation 1913-1919
      • Inflation 1920-1929
      • Inflation 1930-1939
      • Inflation 1940-1949
      • Inflation 1950-1959
      • Inflation 1960-1969
      • Inflation 1970-1979
    • Cumulative Inflation
    • FED Monetary Policy and Inflation
    • Inflation and Recession
    • Confederate Inflation (1861 – 1865)
    • Misery Index
    • The 3 Stages of Inflation
    • 15-Yr Inflation Trends Chart
  • Inflation Calculators
    • Cumulative Inf. Calc.
    • How Much Would it Cost
    • Salary Inf. Calc.
    • Cost of Living Calc.
    • U.K. Inf. Calc.
    • Cost of Gas Calc.
    • Net Worth Calc.
    • Lifetime Earnings Calc.
    • Savings Goal Calc.
    • Financial Calculators
  • Inf. Adjusted Prices
    • Energy >
      • Inflation Adj. Gas Prices
      • Historical Oil Prices Chart
      • Crude Oil Price (Table)
      • Natural Gas Prices
      • Electricity Prices
      • Oil vs Gold
    • Gold >
      • Inflation Adjusted Annual Average Gold Prices
      • Gold is a “Crisis Hedge” not an  “Inflation Hedge”
      • Comparing Oil vs. Gold
    • Corn Prices
    • Education Inflation
    • Housing Prices
    • Mortgage Rates
    • NYSE Index
    • Inf. Indexed Bonds
    • Movie Revenues
    • Inflation-Adjusted Wages
  • Cost of Living
    • Calculate Cost of Living
    • Cost-of-living Adj. (COLA)
    • Consumer Price Index CPI
      • Historical CPI
      • Current CPI
      • CPI Release Dates
    • Gas Prices >
      • Cost of Gas
      • Cost of Gas Per Month
      • Gas vs. Oil Price Chart
    • Food Prices 1913 vs 2013
    • Health Insurance
  • Blog
    • Key Inflation Articles
    • International Inflation
    • Historical Inflation Rates for Japan (1971 to 2014)
You are here: Home » Blog » Uncategorized » June- First Annual Inflation for 2015

June- First Annual Inflation for 2015

Published on July 17, 2015 by Tim McMahon Leave a Comment

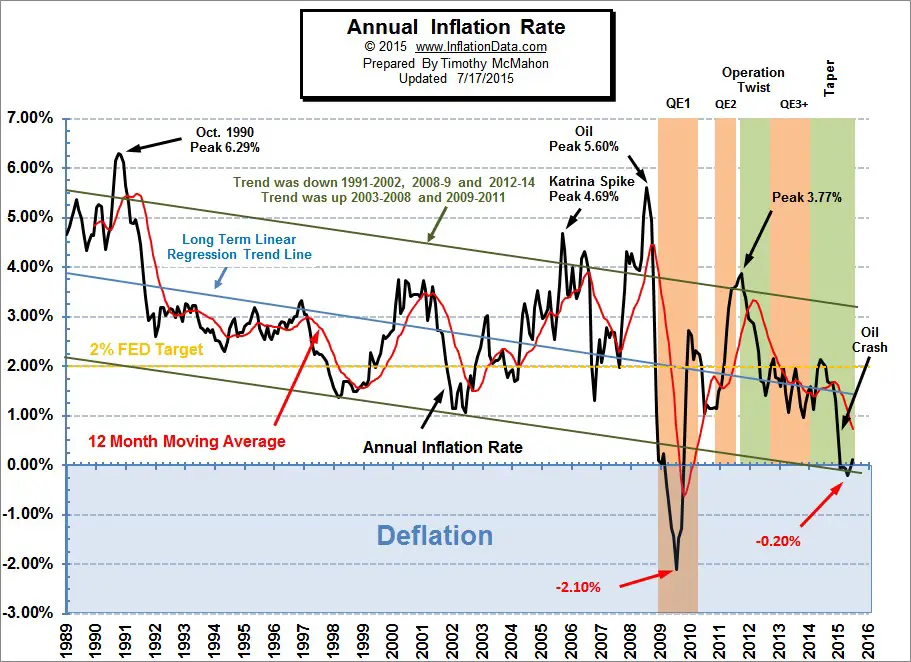
The Bureau of Labor Statistics (BLS) released their monthly Consumer Price Index (CPI-U) and Inflation report for the year ending in June on July 17th. This resulted in 0.12% Annual Inflation. The BLS rounded this to .1% which of course is so small that almost any one of the deflationary months last year would cancel out all the inflation we’ve seen over the previous 12 months. The CPI-U index  a year ago was 238.343 and is currently an almost identical 238.638.

January through May 2015 saw deflation on an annual basis although each month was inflationary in and of itself. But due to the massive deflation of the fourth quarter of 2014, all the monthly inflation was cancelled out. However, June’s monthly inflation finally tipped the scales back toward inflation.

In 2014 the entire 4th quarter was deflationary with October at -0.25% in one month, then November racked up a whopping -0.54%, and December tacked on another -0.57%. And to top it all off the normally highly inflationary January (2015) came in deflationary instead at -0.47%. So those four months alone resulted in -1.83% deflation.

Adding to the deflationary forces for 2014, July and August also saw monthly deflation as prices fell -0.04% and -0.17% respectively. From February 2015 on, we had monthly inflation but it took until June 2015 to wipe out all the previous deflation .

Our Annual Inflation Chart shows how small the current blip is with it barely visible above the zero line. We can also see how small the deflation was according to the BLS for this year.

Annual Inflation

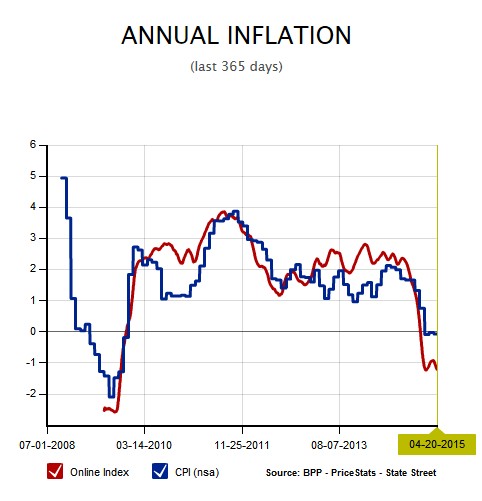
However if we look instead at the independent data from the Billion Price Project a calculation from M.I.T. economists Cavallo and Rigobon, we see a much sharper decrease with deflation at -1% rather than -0.1%. Unfortunately, they delay the public release of their data for 60 days so the most recent data available is from April 20th. For more information see Can We Trust Government Inflation Numbers?

BPP Inflation vs BLS

Wall Street Worries Just a Bit of Inflation Will Shock Markets

If inflation is the dog that didn’t bark in recent years despite massive central bank stimulus, a mere whine might prove enough to rattle investors.

That’s the warning of some economists who are starting to question whether financial markets are underestimating the threat of a pickup in prices among developed nations.

Morgan Stanley is already declaring that global inflation has reached a tipping point and is set to accelerate from close to zero at the start of this year. Pacific Investment Management Co. has recommended buying inflation-linked debt.  Read More…

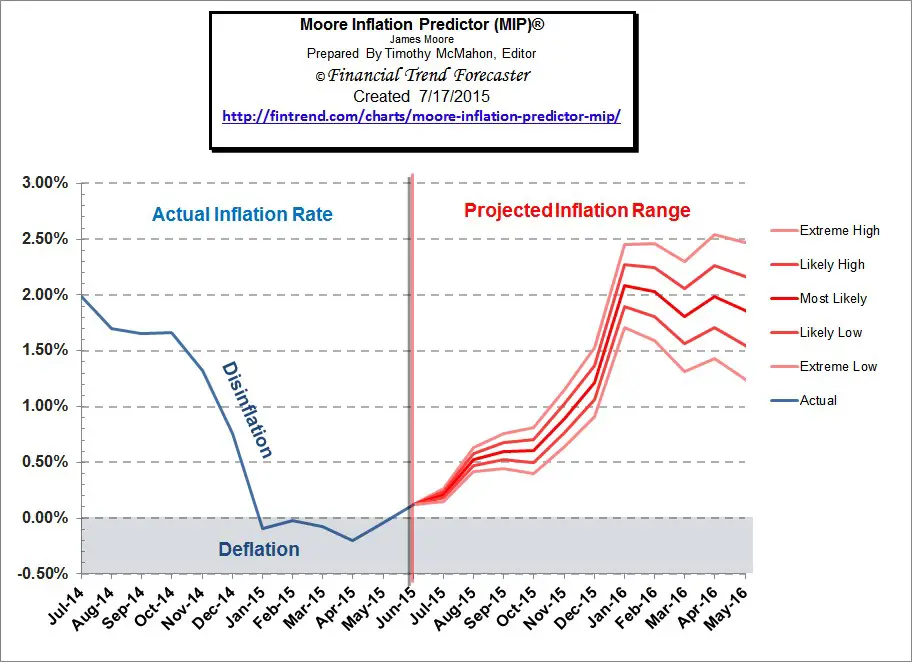
Inflation Projections

Our Moore Inflation projection (MIP) continues to perform well and is projecting a an increase in inflation into year end. However, the new year should see some moderation in the inflation rate. For more information see Inflation Forecast.
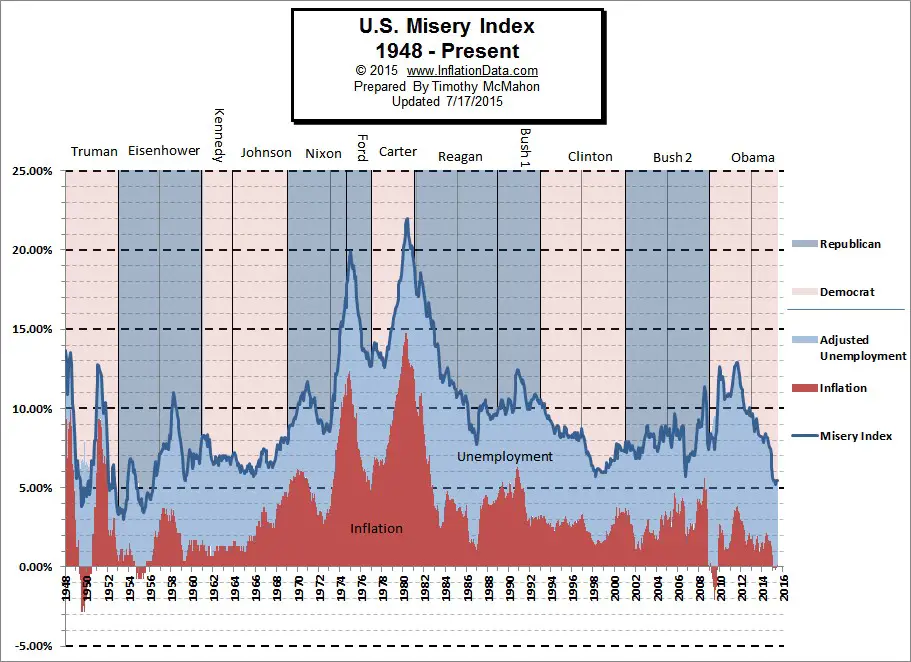
Moore_Inflation_Predictor_Jul_15

Misery Index

The misery index as of July 2015 (based on the most recent official government data for June 2015) is at  5.42% (5.3% unemployment and 0.12% inflation) down from a peak of 12.87% in both October and November 2011.

US Misery Index

You might also like:

  • Bank Closures “Could Never Happen Here”
  • Comparing the Cost of Living When Retiring (or Moving)
  • World War D—Deflation
  • Wall Street Worries Just a Bit of Inflation Will Shock Markets

About Tim McMahon

Connect with Tim on Google+.

  • Web
  • |
  • Twitter
  • |
  • Facebook
  • |
  • LinkedIn
  • |
  • More Posts(404)

Filed Under: Uncategorized Tagged With: BLS, Bureau of Labor Statistics, Consumer Price Index Articles, CPI, Inflation report, June 2015

Leave a Reply Cancel reply

Your email address will not be published. Required fields are marked *

This site uses Akismet to reduce spam. Learn how your comment data is processed.

Latest Posts

  • How Deflation Created the Middle Class
  • October Inflation Numbers Delayed
  • Why the 2.8% COLA May Fall Short of Real Inflation
  • Delayed BLS September Inflation Data Released
  • September CPI Data Delay Causes Social Security COLA Concerns
  • August 2025 Inflation Report
  • Is the FED Getting Soft on Inflation?
  • July Inflation Report

Sponsored:

As a Seasoned Investor I thought I'd seen everything... But recently I discovered TradingView which has really improved the information I have at my fingertips.~ Tim McMahon, editor

TradingView gives me an edge... including powerful charting tools, real-time market data, and a global community of traders—all in one easy to use platform. It has hundreds of indicators, and even custom scripts for more advanced users, and you don't need to change Brokers just use its seamless brokerage integration... TradingView isn't just a charting tool—it's your full trading command center.

Trade smarter. Trade faster. Check Out TradingView for free.

----------

The Best Place to Buy Your Crypto

Coinbase is the largest Crypto Trading platform in the U.S. and the easiest to use. ~Tim McMahon, editor

Check out Coinbase here

Subscribe Now

eTrends Signup Form

Elliott Wave Resources

Free Elliott Wave Resources

What is Waveopedia?

Waveopedia is EWI’s free, comprehensive index of Elliott wave patterns and terms. Everyone from beginners to experts can benefit from it. It’s a great place to send your followers if they’re new to Elliott waves.

  • Deflation Hits China is the U.S. Next?

  • Why You Must Avoid the Herding Trap

  • Chasing Trends Can Cost You

  • More Education Resources

Post Archives

Home | Articles | Sitemap | Terms of Service | Privacy | Disclaimer | Advertise With Us

Copyright © 1996-2025 · Capital Professional Services, LLC · Maintained by Design Synergy Studio · Admin

Do Not Sell My Personal Information