The Bureau of Labor Statistics (BLS) released the inflation statistics for the month of March on April 17th. Once again we have slight deflation on an Annual basis. The Consumer Price index (CPI-U) at the end of March 2015 was 236.119 while it was 236.293 at the end of March 2014. So overall prices are just a hair lower a full year later. That means there was -0.07% inflation and as we all know negative inflation on an annual basis is called Deflation.
Because the BLS rounds all their results to one decimal place they have rounded it to -0.1% , which is what they said it was in January as well. Rounded to two places it is -0.09% for January, -0.03% for February and -0.07% for March which is 3 deflationary months in a row.
Although we have annual deflation monthly prices were actually up significantly with the CPI increasing 0.60% on the month. But the annual rate fell because last year March had monthly inflation of 0.64%.
The major component for the month of March was an increase in Energy prices of 4.1% for the month. On a monthly basis, Food fell -0.3% and all other items less food and energy rose 0.4%. Meanwhile, Medical care increased 0.3%… and Rent increased 0.3%…
On an Annual Basis:
Despite the monthly rebound, energy is still down -18.3% over the year. Over the last nine months we’ve had six months of monthly deflation (annual disinflation) i.e. prices are slightly lower than they were the previous month but still higher than a year ago. But January was the first time we had annual deflation (prices lower than a year earlier). This annual deflation differs from that of 2009. Deflation in 2009 resulted from an implosion of the money supply as the stock and housing markets collapsed. On the other hand, the current deflation is the result of lower energy prices. Most people will benefit from the current situation while most suffered in 2009. The one caveat of the current situation is that most of the job creation since 2009 has come from the energy sector and sustained lower prices could result in a loss of the primary driver for the current economy.
See also: Living in a Free-Lunch World, Deflation Watch: Key Economic Measures Turn South and 100,000 Layoffs and Counting: Is this the New Normal?, Current Annual Inflation Chart, Historical Inflation, and Historical Consumer Price Index.
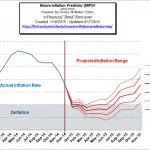
 Just a few months ago, with inflation over 2% no one would have believed that deflation was so close at hand… but this copy of the Moore Inflation Predictor from a couple of months ago shows how we have accurately predicted the coming of deflation and the drop from 1% to below zero. See the current Moore Inflation Predictor chart to see where inflation is going next.


I know what inflation does over the long term, but don’t know what deflation could do over a long term, say over 10-15 years. It seems to be impossible to continue for any period over a year or two.
John, That’s a good question. As money becomes more valuable (increasing purchasing power i.e. deflation) it becomes harder to pay of debts so people stop borrowing. In the short run bankers benefit by being paid off in more valuable dollars but in the long run bankers lose business. That is why bankers and debtors alike fear deflation. The government being the biggest debtor would be hurt the most. And in addition to having to pay with more valuable dollars the government would also have to pay for its bills through taxes rather than the stealth tax of inflation. Once people become more aware of how much the government is actually taking from them the government is put under more pressure to reduce spending so they can’t afford to buy as many votes through social programs. This is highly unlikely so the much more likely scenario is that the government will try to print its way out of deflation. And so as you said deflation will only last a short time.