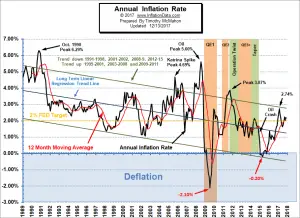
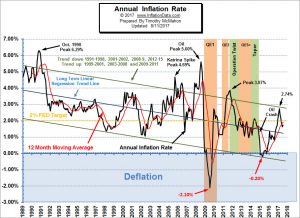
The U.S. Bureau of Labor Statistics released the Annual Inflation Rate data for the year through the end of November on December 13th 2017. Annual inflation was 2.20% in November up from 2.04% in October CPI-U up slightly from 246.663 to 246.669 Monthly Inflation for November 0.002% Next release January 12th Monthly Inflation is Essentially Zero If the annual inflation rate is negative that is called "deflation" (i.e. prices have gone down since the previous year) but whenever the monthly inflation rate is negative that is called "disinflation" (i.e. prices have gone down since the previous month). That is what happened in October 2017. This month the CPI-U … [Read more...]
How Oil Prices Affect Inflation
For a very long time, the prices of oil and inflation have been closely related to each other. When the value of the precious black liquid goes up, inflation follows in the same direction. The reason for this is because oil is a major commodity that's linked to a lot of things. Oil is used to heat homes, power public utilities, as well as run factories it is also a direct component in things like plastics. That being said, if the input cost for oil rises, so will the costs of finished products and services. The direct association between oil and inflation was first recorded in the 70s. It was at the time when the cost per barrel rose from $3 in 1973 to $40 in the 1979 oil crisis. This … [Read more...]
October Data says Disinflation
The U.S. Bureau of Labor Statistics released the Annual Inflation Rate data for the year through the end of October on November 15th 2017. Annual inflation was 2.04% in October down from 2.23% in September. CPI-U 246.663 Monthly Inflation for October -0.06% Next release December 13th Monthly Inflation is Negative Whenever the monthly inflation rate is negative that is called "disinflation" i.e. prices have gone down since the previous month. If the annual inflation rate is negative that is called "deflation". In October we had disinflation as prices fell slightly (but not below year ago levels). The CPI-U index fell from 246.819 in September to 246.663 in October. … [Read more...]
Ways Inflation Affects the Real Estate Market Pt. 2
In Part 1 of this series on Real Estate and Inflation, we discussed how monetary inflation creates price inflation which affects materials costs, creates a shift into rentals and a surge in foreclosures. But on the flip side, being a commodity itself, home ownership can provide protection against inflation and through the use of a mortgage allows you to pay off an appreciating asset with depreciating dollars. This time we will look at a few more effects of Inflation on the average home buyer. In a period of high inflation, a dollar's value decreases rapidly. On average, a 2 percent inflation rate means that what costs $1 in 2017 would cost roughly $1.02 in 2018. Although inflation is … [Read more...]
Ways Inflation Affects the Real Estate Market
Inflation from January 2007 through December 2016 was extremely low, averaging only 1.77% per year in the U.S. and 2009 was actually negative (i.e. falling prices = deflation). Although 2017 has seen a bit more inflation it is still low by historical standards. In times of low inflation, inflation is a vague term that economists throw around when they’re trying to make one point or another. However, when inflation begins rising and hitting your pocket, the reality begins to set in. And it can have a quite noticeable effect on, not only the goods you buy at your favorite big box store, but even on real estate. Let’s take a quick look at some ways rising (or sinking) prices get their tentacles … [Read more...]
Inflation Up, NYSE New High
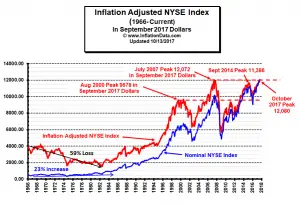
Current Inflation Situation On October 13th the Bureau of Labor Statistics released the Consumer Price Index inflation information for September. The CPI-U index was 246.819 up from 245.519 in August. This resulted in an annual inflation rate for the 12 months through September 2017 of 2.23% up from 1.94% in August, 1.63% in June and 1.73% in July. Monthly inflation was a whopping 0.53% for September primarily due to a 12% increase in gasoline prices due to refinery shutdowns in response to hurricanes. See our Annual Inflation Chart for more info. NYSE Makes New High in Inflation Adjusted Terms! To get a true picture of the state of the market it helps to look at the … [Read more...]
Monthly Inflation Spikes in August
The U.S. Bureau of Labor Statistics released the Annual Inflation Rate data for the year ending in August on September 14th 2017. Annual inflation was 1.94% in August up from 1.73% in July. CPI-U 245.519 Monthly Inflation for August 0.30% Next release October 18th According to the U.S. Bureau of Labor Statistics (BLS) - "Increases in the indexes for gasoline and shelter accounted for nearly all of the seasonally adjusted increase in the all items index. The energy index rose 2.8 percent in August as the gasoline index increased 6.3 percent. The shelter index rose 0.5 percent in August with the rent index up 0.4 percent. The food index rose slightly in August, with the … [Read more...]
OECD International Inflation Rates
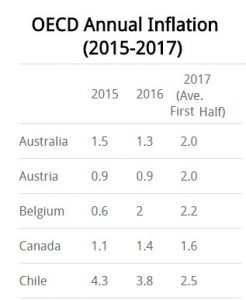
On Friday August 11th the OECD published the Annual Inflation Rates rates of its member countries plus several other countries as well. Noticeably absent is Argentina. The OECD included the following footnote: Data for Argentina are currently not available due to the state of emergency in the national statistical system declared by the government of Argentina on 07 January 2016. As a consequence, Argentina is not included in the calculation of the G-20 aggregate. The policy regarding the inclusion of Argentina will be reconsidered in the future depending on further developments. In November 2015, Mauricio Macri was elected in Argentina under the platform of reforming the government of … [Read more...]
July CPI Down But Inflation Up
The Bureau of Labor Statistics Released the Inflation Data for the Year ending in July on August 11th. Annual inflation was 1.73% in July - Up from 1.63% in June, but down from 1.87% in May, 2.20% in April, 2.38% in March, 2.74% in February, and 2.50% in January. CPI 244.786 in July down from CPI 244.955 in June Monthly Inflation for July -0.07%, June 0.09%, May 0.09%, April was 0.30%, March was 0.08%, February was 0.31% and 0.58% in January. Next release September 14th The reason the CPI went down but inflation went up is because July 2016 monthly inflation was -0.16% and this July was less negative. So CPI goes down for the month but not as much as last year so Annual … [Read more...]
Inflation 1.63% in June
The U.S. Bureau of Labor Statistics released the Annual Inflation Rate data for the year ending in June on July 14th 2017. Annual inflation was 1.63% in June - down from 1.87% in May, 2.20% in April, 2.38% in March, 2.74% in February, and 2.50% in January. June CPI-U 244.955-- May CPI-U 244.733 Monthly Inflation for June 0.09%, May 0.09%, April was 0.30%, March was 0.08%, February was 0.31% and 0.58% in January. Next release August 11th Annual Inflation Chart Annual inflation for the 12 months ending in June 2017 was 1.63% down from 1.87% in May, 2.20% in April, 2.38% in March, 2.74% in February and 2.50% in January. The annual cyclical low was 0.84% in July 2016. The … [Read more...]

