We just received notification that InflationData was Ranked the Number 1 Inflation Blog according to Feedspot Inflation Blogs: Their commentary says: "We’ve carefully selected these websites because they are actively working to educate, inspire, and empower their readers with frequent updates and high-quality information." #1 InflationData- That's us. But I thought you might find it interesting to see who else ranked in the top 10 so here they are: … [Read more...]
April Inflation UP
The U.S. Bureau of Labor Statistics released the Annual Inflation Rate data for the year through the end of April on May 10th 2018. Annual Inflation is Up Annual inflation rate was 2.46% up from 2.36% in March and 2.21% in February. CPI was 250.546 in April, 249.554 in March, 248.991 in February, 247.867 in January and 246.524 in December. Monthly Inflation for April was 0.40%, up from 0.23% in March 2018 Next release June 12th Monthly Inflation: Annual inflation for the 12 months ending in April was 2.46% up from 2.36% in March. February was 2.21% and January was 2.07%. Early in 2017 inflation was 2.50% in January, 2.74% in February and 2.38% in … [Read more...]
How Does Inflation Affect the Price of Gold?
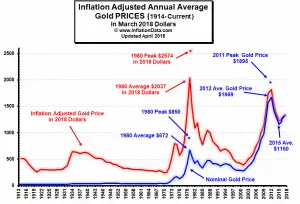
Gold bugs often fear inflation and believe that gold will generally increase in price when inflation is high. But the correlation is not as simple as when inflation increases the price of gold increases. If it were, the inflation adjusted price of gold would be virtually flat. And as we can see from the chart below the red line is far from flat. From 1913 through 1970 the "nominal price" of gold was fixed by the government and so it remained relatively stable but that didn't mean that the purchasing power of an ounce of gold remained stable. From 1880-1914 the U.S. dollar official gold price was $20.67 per ounce. But inflation was rampant in the economy (i.e. over 90% inflation just … [Read more...]
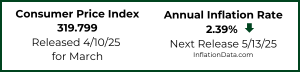
March Inflation Data Released
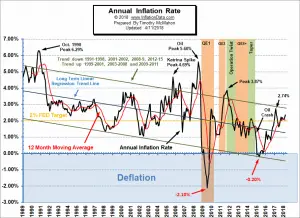
The U.S. Bureau of Labor Statistics released the Annual Inflation Rate data for the year through the end of March on April 11th 2018. Annual Inflation is Up Annual inflation rate was 2.36% up from 2.21% in February. CPI was 249.554 in March, 248.991 in February, 247.867 in January and 246.524 in December. Monthly Inflation for March 2018= 0.23% Monthly Inflation for March 2017= 0.08% Next release May 10th Monthly Inflation: Typically the monthly inflation rate is highest during the first quarter (January through March) and lowest during the last quarter (October through December). March 2018 had 0.23% monthly inflation which was below February's 0.45% but it … [Read more...]
The Effects of Inflation and Interest Rates on Commodity Prices
In common usage, inflation refers to steadily rising prices of goods and services over time, while "deflation" relates to falling prices. Inflation is both a boon and a bane to the economy and the rate of inflation is affected by a variety of factors including FED monetary policy, interest rates, supply vs. demand, and the Velocity of money. However, strictly speaking, rising prices are "price inflation" which is generally caused by "monetary inflation" i.e. the expansion of the money supply, among other things. See What is Inflation? for more info. Many Keynesian Economists believe that Inflation is a prerequisite for economic growth and prosperity and Keynesians believe Monetary … [Read more...]
February Inflation Report
The U.S. Bureau of Labor Statistics released the Annual Inflation Rate data for the year through the end of February on March 13th 2018. Annual inflation was 2.21% in February up from 2.07% in January and 2.11% in December CPI-U was 248.991 in February from 247.867 in January. Monthly Inflation was 0.45% for February and 0.54% in January. Next release April 11th Monthly Inflation is Typically High in the First Quarter Typically the monthly inflation rate is highest during the first quarter (January through March) and lowest during the last quarter (October through December). February 2018 had inflation of 0.45% which was above February 2017's 0.31% so we saw an increase in … [Read more...]
January’s Monthly Inflation 0.54%
The U.S. Bureau of Labor Statistics released the Annual Inflation Rate data for the year through the end of January on February 14th 2018. Annual inflation was 2.07% in January down from 2.11% in December CPI-U up from 246.524 to 247.867 Monthly Inflation for January 0.54% compared to 0.57% in January 2017 Next release March 13th Monthly Inflation is High, But... Typically the monthly inflation rate is highest during the first quarter (January through March) and lowest during the last quarter (October through December). January 2017 had inflation of 0.57% and so January 2018's 0.54% is right in line with that (resulting in annual inflation of 2.07%). However if … [Read more...]
Hyperinflation: 5 Currencies that Self-Destructed

Over the years we have discussed Hyperinflation a number of times. We've explained that, "Hyperinflation is an extremely rapid period of inflation, usually caused by a rapid increase in the money supply. Usually due to unrestrained printing of fiat currency." Hyperinflation has been recorded as far back as Egypt 276 AD and is usually caused due to some sort of government mismanagement issue. Typically hyperinflation gets progressively worse until the curve goes hyperbolic and then something happens to end the progression. See What is Hyperinflation? for more information. Recently Commodity.com produced an Infographic of 5 currencies that were hit by hyperinflation so with their … [Read more...]
Annual Inflation Rates Not Uniform Throughout the Country
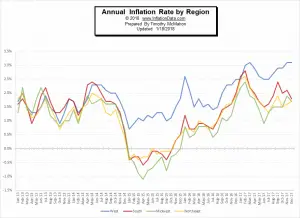
Every so often I get a reader who writes a comment accusing me (although the numbers actually come from the Bureau of Labor Statistics) of underestimating the actual inflation rate. He reasons that, since his favorite bread cost $3.00 last year and now it costs $3.50... how can inflation possibly be only 2%? Typically my answer has been that individual items can change but actually cancel each other out. Such as in February 2015 when things like “meat, poultry, fish and eggs” increased 7.6% but energy prices fell enough to make the overall CPI slightly less than zero (i.e. deflationary). But this month we actually see evidence of another explanation. Annual Inflation for the year ending … [Read more...]
Monthly Deflation, Annual Disinflation
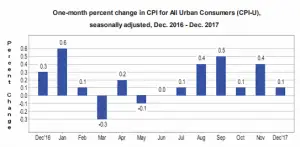
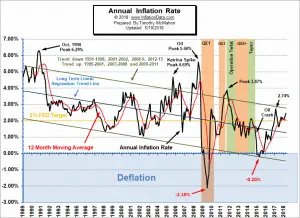
The U.S. Bureau of Labor Statistics released the Annual Inflation Rate data for the year through the end of December on January 12th 2018. Annual inflation was 2.11% for the 12 months ending in December CPI-U down slightly from 246.669 to 246.524 Monthly Inflation for December -0.06% Next release February 14th Annual Inflation Chart Annual inflation for the 12 months ending in December 2017 was 2.11% down from 2.20% in November and slightly above the 2.04% in October. Early in 2017 inflation was above current levels at 2.50% in January, 2.74% in February, 2.38% in March, and then falling to 2.20% in April. The annual cyclical low was 0.84% in July 2016. The longer term … [Read more...]
