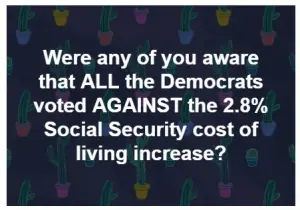
There is a meme circulating around Facebook right now about Democrats voting against the 2.8% Cost of living increase. Normally, here at inflationData we try to avoid politics unless it directly relates to inflation, or our other major topics covered. But in this case I feel compelled to address this issue. The quick answer is that this is "NOT TRUE". However, if the MEME was phrased slightly differently it would be "TECHNICALLY TRUE". If the Meme said, "NONE of the Democrats voted FOR the Social Security Cost of Living Increase" it would be "TECHNICALLY TRUE". Likewise, if it said "NONE of the Republicans voted FOR the Social Security Cost of Living Increase" it would also … [Read more...]
September Annual Inflation Down to 2.28%
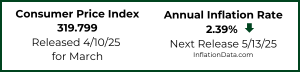
The U.S. Bureau of Labor Statistics (BLS) released their monthly Consumer Price Index report on October 11th 2018, for the 12 month period through the end of September. Annual Inflation is Down Annual inflation was down from 2.70% in August and 2.95% in July to 2.28% in September. CPI was 252.439 in September, 252.146 in August, 252.006 in July and 251.989 in June. Monthly Inflation for September was 0.12%, August was 0.06%, July was 0.01%, and June was 0.16% compared to 0.53% in September 2017. Next release November 14th Monthly Inflation: Annual inflation for the 12 months ending in September was 2.28% down from 2.70% in August. "The Consumer Price Index for All … [Read more...]
August Inflation Down
On September 13th 2018, the U.S. Bureau of Labor Statistics released their monthly Consumer Price Index report on the status of Inflation for the 12 months through the end of August. Annual Inflation is Down Annual inflation in August was 2.70% down from 2.95% in July and 2.87% in June. (BLS rounds both to 2.9%) CPI was 252.146 in August, 252.006 in July and 251.989 in June. Monthly Inflation for August was 0.06%, July was 0.01%, and June was 0.16% compared to 0.30% in August 2017. Next release October 11th Monthly Inflation: Annual inflation for the 12 months ending in August was 2.70%. 2.95% up from 2.87% in June. The U.S. Bureau of Labor Statistics (BLS) rounds … [Read more...]
Can Crypto Solve Venezuela’s Hyperinflation Problem?

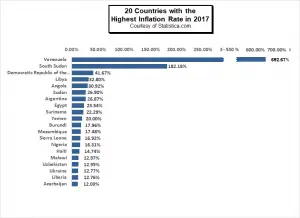
It is important to note that Hyperinflation doesn't just happen to a country's currency for no reason. In What is Hyperinflation? we found that "Hyperinflation is an extremely rapid period of inflation, usually caused by a rapid increase in the money supply. Usually due to unrestrained printing of fiat currency." Generally, the increase in the money supply is because the government can't pay its debts so it simply prints more money, these debts are usually the result of War, Corruption, or Fiscal Mismanagement. In Venezuela's case, the problem is not that they don't have the assets (they have some of the largest oil reserves in the world), but rather it is a result of their economic … [Read more...]
Cost of Living: LA and New York vs. The World
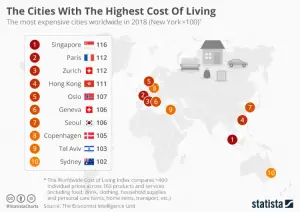
Los Angeles When you think of a city with a "high cost of living" you might think of Los Angeles. After all, you've probably seen some HGTV show where Tarek and Christina or The Property Brothers buy a tiny old house for half a million dollars and it needs a ton of renovations just to make it livable! So LA has to be an expensive place to live... right? Well compared to New York... not so much. According to PayScale's Cost of Living Calculator the cost of living in New York, NY is actually 60% higher than Los Angeles. Looked at another way, even though the Cost of Living in LA is 48.0% above U.S. average, Los Angeles is still only the 9th most expensive city in the U.S. when it comes to … [Read more...]
July Inflation Up a Fraction
On August 10th 2018, the U.S. Bureau of Labor Statistics released their monthly Consumer Price Index report on the status of Inflation for the 12 months through the end of July. Annual Inflation is Up Very Slightly Annual inflation in July was 2.95% up slightly from 2.87% in June. (BLS rounds both to 2.9%) CPI was 252.006 in July and 251.989 in June. Monthly Inflation for July was 0.01%, and 0.16% in June compared to -0.07% in July 2017. Next release September 13th Monthly Inflation: Annual inflation for the 12 months ending in July was 2.95% up from 2.87% in June. The U.S. Bureau of Labor Statistics (BLS) rounds both to 2.9% and accordingly reports the inflation rate … [Read more...]
Annual Inflation Up Slightly in June
The U.S. Bureau of Labor Statistics released the Annual Inflation Rate data for the year through the end of June on July 12th 2018. Annual Inflation is Up Annual inflation rate was 2.87% in June up from 2.80% in May, 2.46% in April, 2.36% in March and 2.21% in February. CPI-U was 251.989 in June, 251.588 in May, 247.867 in January and 246.524 in December. Monthly Inflation for June was 0.16% while May was 0.42%, April was 0.40%, up from 0.23% in March 2018. June 2017 was only 0.09% Next release August 10th Monthly Inflation: Annual inflation for the 12 months ending in June was 2.87% up slightly from May's 2.80% but up sharply from April's 2.46%. Current levels are … [Read more...]
What Impact (if any) Does Disruption have on Inflation?
What is "Disruption"? According to Dictionary.com: forcible separation or division into parts. a disrupted condition: After the coup, the country was in disruption. Business. a radical change in an industry, business strategy, etc., especially involving the introduction of a new product or service that creates a new market: 2018 is seeing our world change rapidly in so many ways some due to various disruptions. This has caused some people to ask if disruptions cause inflation. This year U.S. inflation as of June is up from 1.63% in 2017 to 2.80% in 2018. Inflation on a global scale is a percent or two higher at 3.15% in 2017, and projected to see out the year 2018 at 3.31%. … [Read more...]
Annual Inflation Up Sharply in May
The U.S. Bureau of Labor Statistics released the Annual Inflation Rate data for the year through the end of May on June 12th 2018. Annual Inflation is Up Annual inflation rate was 2.80% in May up from 2.46% in April, 2.36% in March and 2.21% in February. CPI-U was 251.588 in May, 250.546 in April, 249.554 in March, 248.991 in February, 247.867 in January and 246.524 in December. Monthly Inflation for May was 0.42%, April was 0.40%, up from 0.23% in March 2018. May 2017 was only 0.09% Next release July 12th Monthly Inflation: Annual inflation for the 12 months ending in May was 2.80% up sharply from April's 2.46% the increase was primarily because May 2017's … [Read more...]
Inflation Risk
What is Inflation Risk? Inflation Risk aka. "Purchasing Power Risk" is the risk due to "a decrease in purchasing power of assets or cash flow" due to inflation. A typical example would be a bond that generates a fixed rate of return. For instance, suppose this bond is worth $1000 and generates a 5% yield i.e. $50. Suppose when you purchase the bond that $50 will buy two tanks of gas for your car. Over time inflation will reduce the purchasing power of that $50 so it only buys one tank of gas. If you are counting on using the proceeds of the bond to buy gas there is an "inflation risk" that eventually you will not be covered. The worst-case example of inflation risk is if a country … [Read more...]
