Los Angeles
When you think of a city with a “high cost of living” you might think of Los Angeles. After all, you’ve probably seen some HGTV show where Tarek and Christina or The Property Brothers buy a tiny old house for half a million dollars and it needs a ton of renovations just to make it livable! So LA has to be an expensive place to live… right? Well compared to New York… not so much.
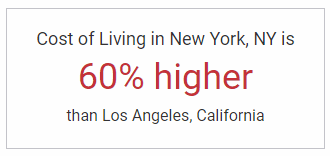
According to PayScale’s Cost of Living Calculator the cost of living in New York, NY is actually 60% higher than Los Angeles. Looked at another way, even though the Cost of Living in LA is 48.0% above U.S. average, Los Angeles is still only the 9th most expensive city in the U.S. when it comes to cost of living. According to Kiplinger As we can see from the table below even Brooklyn, NY has a higher cost of living than LA. Other higher cost cities include Washington, D.C. and LA neighbors, Seattle, WA, Oakland, CA and San Francisco (which is #2 and almost double the national average). But the #1 most expensive city in the U.S. is New York, NY (aka. Manhattan) with a cost of living at 138.6% above, it is way more than double the national average.
The following U.S. cities have the highest cost of living:
| Cost of living Rank | City | Above U.S. Average |
| #8 | Boston, MA | 48.2% |
| #7 | Seattle, WA | 49.0% |
| #6 | Oakland, CA | 49.5% |
| #5 | Washington, D.C. | 55.7% |
| #4 | Brooklyn, NY | 82.0% |
| #3 | Honolulu, HI | 88.2% |
| #2 | San Francisco, CA | 92.9% |
| #1 | New York, NY | 138.6% |
Comparing LA Costs to New York
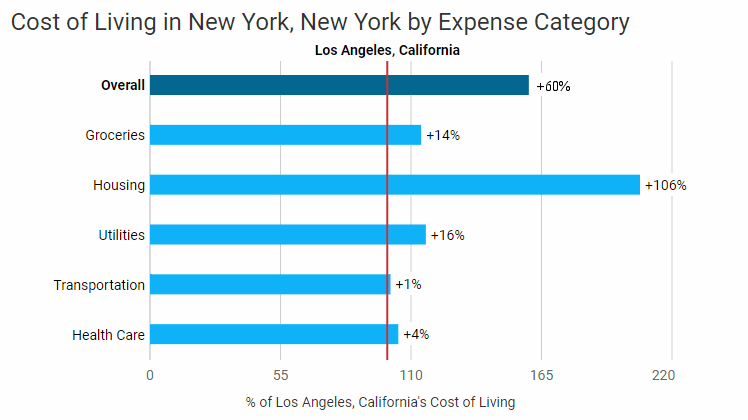
Payscale’s COL calculator gives us the following breakdown of costs. This time we are comparing Manhattan’s costs compared to LA rather than the national average. From the chart below we can see that overall Manhattan is 60% more expensive than LA. with Groceries costing 14% more in NY, Utilities costing 16% more, Transportation 1% more, Health Care costing 4% more and Housing costing a whopping 106% more in Manhattan than in LA.
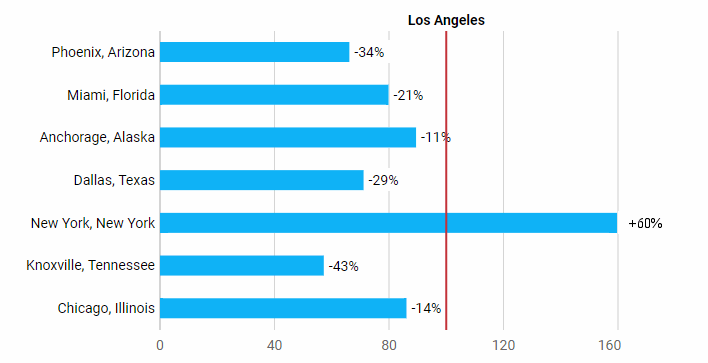
 As you might expect, comparing some other cities to LA we find Dallas, Knoxville and Phoenix to be considerably cheaper. But as we can see even Miami, Anchorage and Chicago are cheaper than LA.
New York, NY as a Baseline
Even though New York is the most expensive city in the U.S. it is not the most expensive city in the world by a long shot. In this chart from Statista using data collected by the Economist, we can see that they have used New York as the baseline i.e. New York is set to equal 100% and we see that New York doesn’t even make the top 10 most expensive cities. At the top of the list for the 5th year in a row is Singapore followed by Paris, Zurich and Hong Kong.
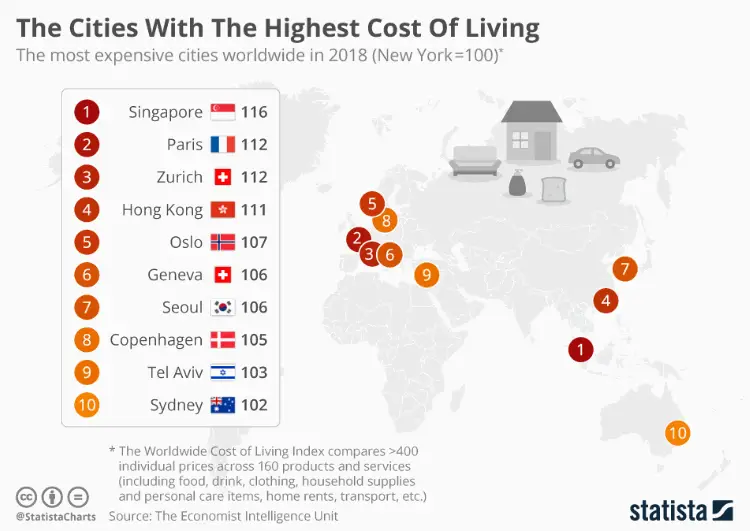
The survey, which compares the price of over 150 items in 133 cities around the world, found that Singapore was 16% more expensive than the benchmark city of New York. New York itself came in 13th with LA coming in 14th in this survey presenting slightly different results than the Kiplinger survey mentioned above. An interesting relatively new source of cost of living data is Numbeo which uses user generated data to compare the cost of living around the world. According to their surveys, Hamilton Bermuda is the most expensive place to live primarily because they do not include one of the most expensive items included in the Economist basket of goods, i.e. the cost of car ownership which drastically drives up the cost of living in places like Singapore. However, typically most people in Singapore don’t own a car and use public transportation thus possibly making Numbeo’s numbers more realistic for the common person. Numbeo surveys once again use indices relative to New York City (NYC). Which means that for New York City, each index should be 100%. Unlike the economist which uses 150 items Numbeo only looks at Rent, Groceries, Restaurant and the “Local Purchasing Power” which compares costs to the average salaries in the area. According to Numbeo, “Local Purchasing Power shows relative purchasing power in buying goods and services in a given city for the average wage in that city. If domestic purchasing power is 40, this means that the inhabitants of that city with the average salary can afford to buy on an average 60% less goods and services than New York City residents with an average salary.”
Using Numbeo’s scale, Los Angeles is number 44 world wide, less expensive than Philadelphia (#40), Boston (#31), Seattle (#28), Rockville, MD (#23), and Charleston, SC (#21) but more expensive than Singapore (#92).
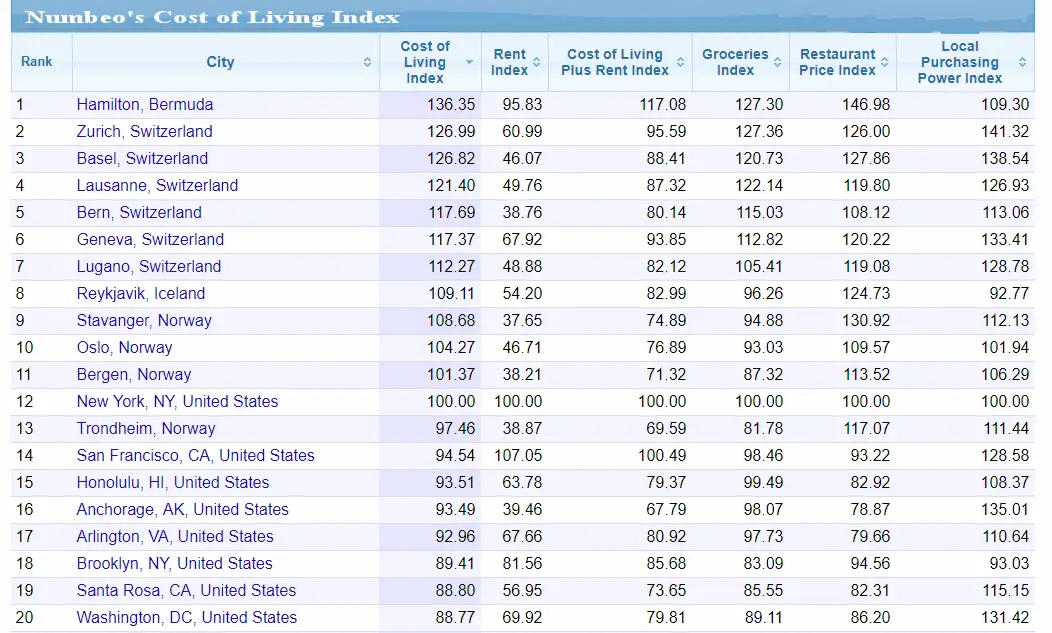
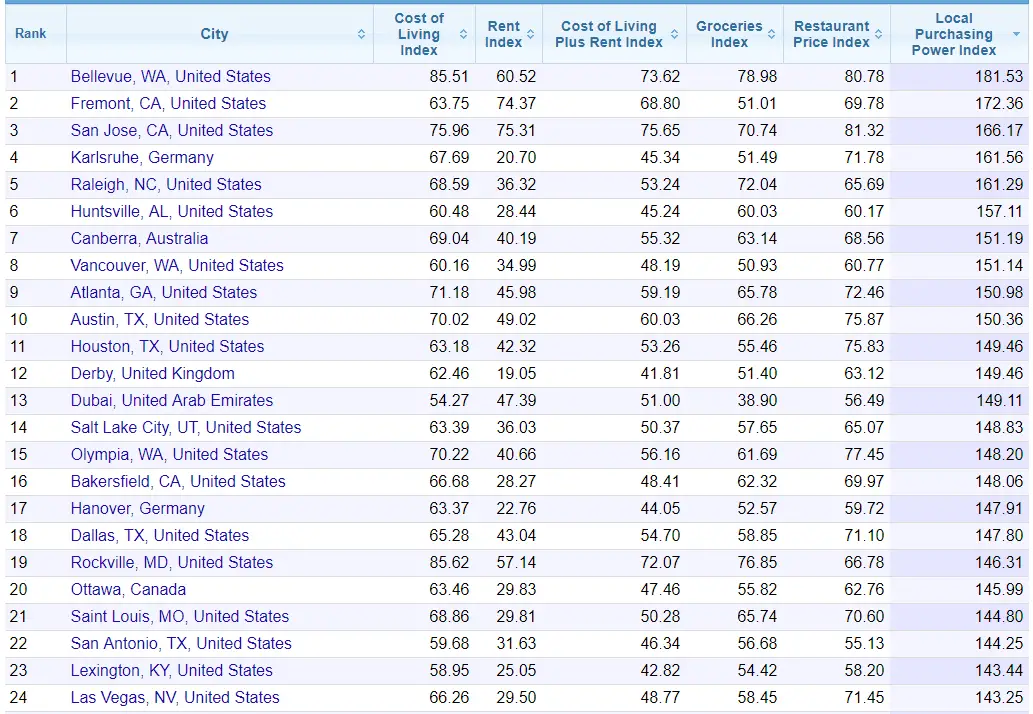
Interestingly, even though Zurich, Switzerland ranks higher than New York on all the lists if you look at the “Local Purchasing Power Index” the residents of Zurich are actually better off than the residents of New York. In sorting the Numbeo list by Local Purchasing Power we see that residents of some surprising places are better off than we would expect. It is also interesting to note that among the top 24 most affordable cities for local residents, 18 are located in the United States.
You might also like:
- What Impact (if any) Does Disruption have on Inflation?
- Debt and Inflationary Pressures: A Lesson in Economic Interactivity
- Annual Inflation Up Sharply in May
- Inflation Risk
- Cost of Living Calculator
- Cost of Living Articles

Kirk Follini asked, “Tokyo Japan is Extremely Expensive but not on the list?”
Good Question! When I looked at Numbeo I found Tokyo ranked #25
Numbeo Summary about cost of living in Tokyo:
Four-person family monthly costs: 3,886.87$ (436,038.94¥) without rent (using our estimator).
A single person monthly costs: 1,079.53$ (121,104.36¥) without rent.
Cost of living index in Tokyo is 14.35% lower than in New York.
Cost of living rank 25th out of 529 cities in the world.
Tokyo has a cost of living index of 85.65.
https://www.numbeo.com/cost-of-living/in/Tokyo