
The Bureau of Labor Statistics Released the Inflation Data for the 12 months ending in May on June 10th.
Inflation is virtually ZERO at 0.12%.
Annual Inflation Retreats
- Annual Inflation fell again to 0.12% in May from 0.33% in April.
- CPI Index rose marginally from 256.389 in April to 256.394 (virtually identical).
- Monthly Inflation for May was 0.002%, April was -0.67%, March was -0.22%, February was 0.27%… typically January through May are highly inflationary so this is VERY unusual.
- The FED continues to crank up the “printing presses” using “Quantitative Easing” in an effort to stimulate the economy in the wake of COVID-19.
- FED Funds Rate remains near Zero.
- Next release July 14th
Annual inflation for the 12 months ending in May was 0.12%, April was 0.33%, March was 1.54% down sharply from February’s 2.33% and January’s 2.49%.
The CPI index itself was up very marginally to 256.394 from 256.389 in April down from 258.115 in March. Resulting in a monthly inflation rate so small we had to go to 3 digits to measure it. 0.002% i.e. virtually zero. The annual inflation rate got closer to zero as well going from 0.33% in April to 0.12% in May.
 Prices falling on a monthly basis but rising on an annual basis is called disinflation.
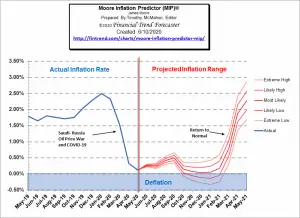
The Moore Inflation Predictor is showing the possibility of actual Deflation late in 2020. But there is also the possibility that the massive FED money creation will result in much higher inflation and some people fear actual hyperinflation.
Monthly Inflation:
According to the BLS commissioner’s report, “The Consumer Price Index for All Urban Consumers (CPI-U) declined 0.1 percent in May on a seasonally adjusted basis after falling 0.8 percent in April, the U.S. Bureau of Labor Statistics reported today. Over the last 12 months, the all items index increased 0.1 percent before seasonal adjustment.
Declines in the indexes for motor vehicle insurance, energy, and apparel more than offset increases in food and shelter indexes to result in the monthly decrease in the seasonally adjusted all items index. The gasoline index declined 3.5 percent in May, leading to a 1.8-percent decline in the energy index. The food index, in contrast, increased 0.7 percent in May as the index for food at home rose 1.0 percent. “
Seasonally Adjusted Inflation Table
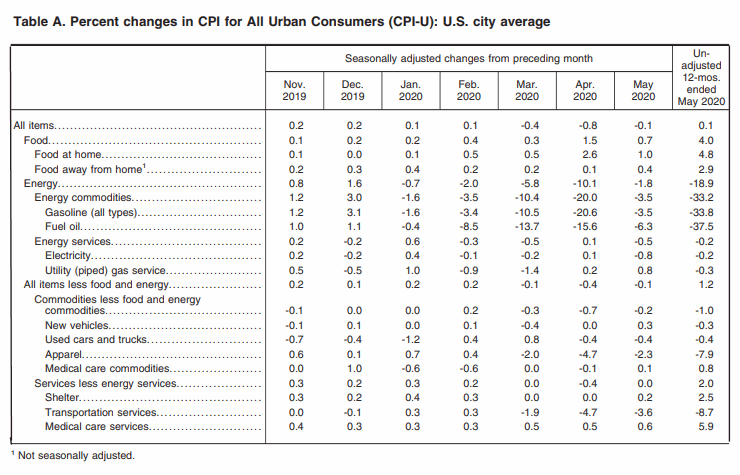
The key words from the Commissioner’s report are “Seasonally Adjusted” and “Monthly” we can see the -0.8% that he’s talking about at the top of the April column. The 12 month unadjusted column shows 0.1% which we calculate to two decimal places at 0.12%.
From the May 2020 column in the table above we can see that on a MONTHLY seasonally adjusted basis, Energy was down -1.8%. On a Non-adjusted annual basis, however, Energy was down -18.9%, over the entire year.
On a monthly basis, in May, Gasoline was down -3.5% and fuel oil was down -6.3%, Food was up 0.7%, Apparel was down -2.3%, Transportation Services were down -3.6%, and Medical care services were up 0.6%.
Current Inflation Situation
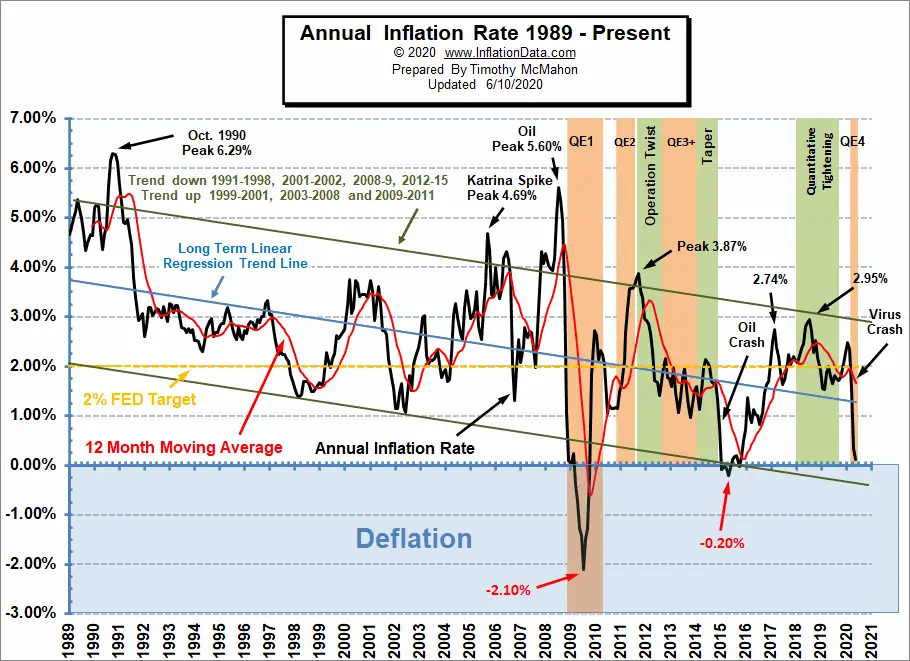
Annual inflation for the 12 months ending in May was an astonishingly low 0.12% down sharply in spite of the massive money creation by the FED… primarily due to lower oil prices and the Coronavirus shutdown. It was 0.33% in April, 1.54% in March, 2.33% in February and 2.49% in January.
The CPI index itself was 256.394 in May, 256.389 in April, down from 258.115 in March, 258.678 in February and 257.971 in January.
For more information See Annual Inflation.
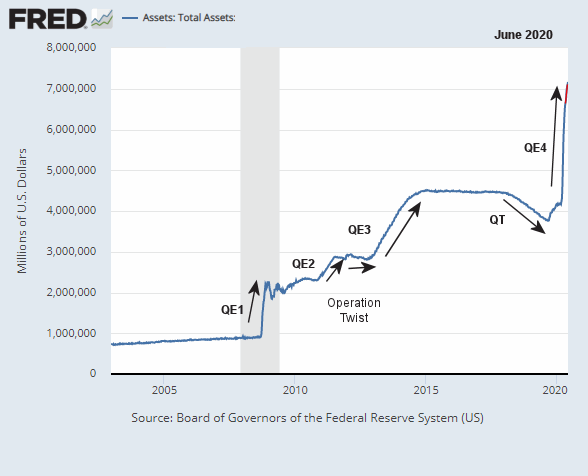
 Federal Reserve Actions
In response to the recent Coronavirus stock market crash, the FED has implemented QE4 equal in speed to QE1 and greater in magnitude than QE1 through QE3 combined. Many believe that this will create massive inflation in the days to come. We’ve highlighted the May increase in Red. See Inflation Expectations and the Massive Fed Stimulus and Will the $2 Trillion Covid-19 Stimulus Cause Inflation? for more information.
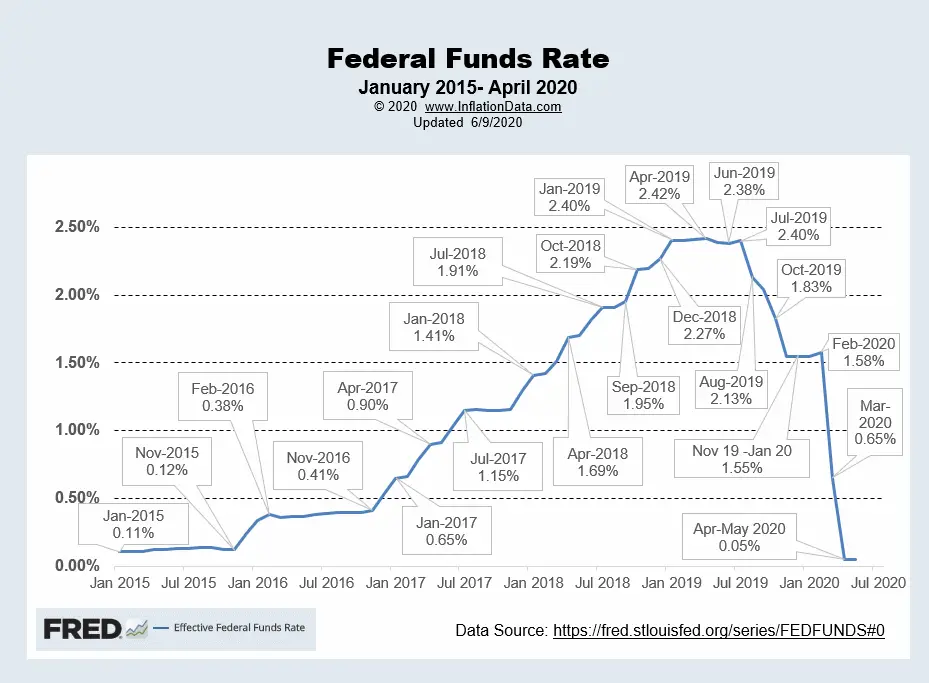
FED Funds Rate
In this chart, we can see that the FED reduced the FED Funds Rate beginning in August 2019 through November 2019. From there through February 2020 they have were relatively flat. But in March in an effort to fight a coming market crash due to falling oil prices and coronavirus fears the FED dropped rates to 0.65% with hints that they might go as low as 0% or possibly even negative. In April they reduced rates to virtually zero (i.e. 0.05%) and held it at that level in May.
 For more info See NYSE ROC and MIP.
Not Seasonally Adjusted Monthly Inflation Rates
| Jan | Feb | Mar | Apr | May | Jun | Jul | Aug | Sep | Oct | Nov | Dec | |
| 2016 | 0.17% | 0.08% | 0.43% | 0.47% | 0.41% | 0.33% | (0.16%) | 0.09% | 0.24% | 0.12% | (0.16%) | 0.03% |
| 2017 | 0.58% | 0.31% | 0.08% | 0.30% | 0.09% | 0.09% | (0.07%) | 0.30% | 0.53% | (0.06%) | 0.002% | (0.06%) |
| 2018 | 0.54% | 0.45% | 0.23% | 0.40% | 0.42% | 0.16% | 0.01% | 0.06% | 0.12% | 0.18% | (0.33%) | (0.32%) |
| 2019 | 0.19% | 0.42% | 0.56% | 0.53% | 0.21% | 0.02% | 0.17% | (0.01%) | 0.08% | 0.23% | (0.05%) | (0.09%) |
| 2020 | 0.39% | 0.27% | (0.22%) | (0.67%) | 0.002% |
See: Monthly Inflation Rate for more information and a complete table of Unadjusted Monthly Rates.
Misery Index
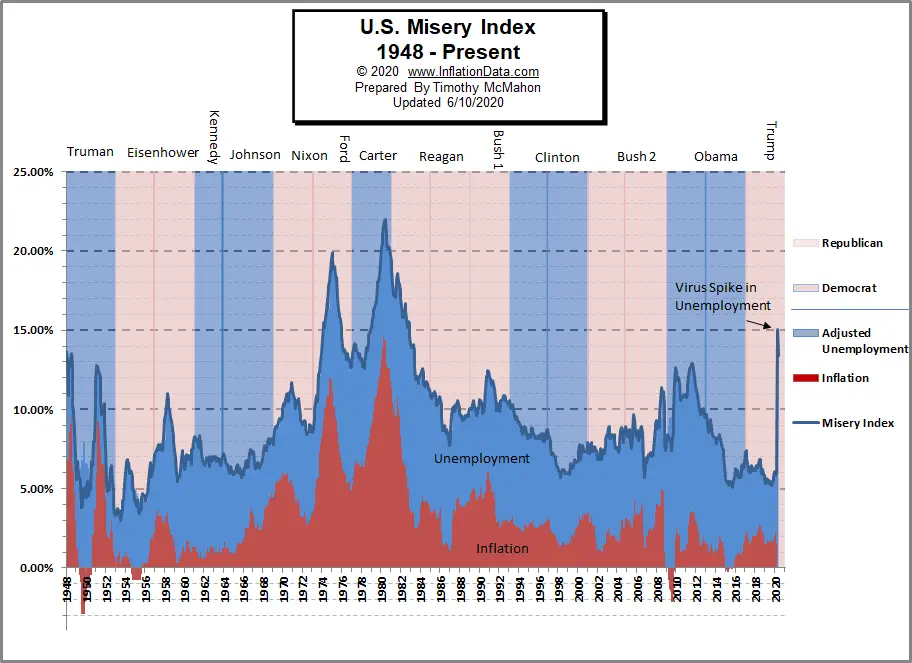
In April the Misery Index shot up to 15.03% based on 14.7% unemployment and 0.33% inflation. In May it fell back slightly due to a decrease in the Unemployment rate as some people began returning to work. The highest peak for 2019 was at 5.79% in December and the Low was in September at 5.21%. Previous peaks were 6.87% in July 2018 and 7.44% in February 2017.
[Read More…]
NYSE Rate of Change (ROC)©
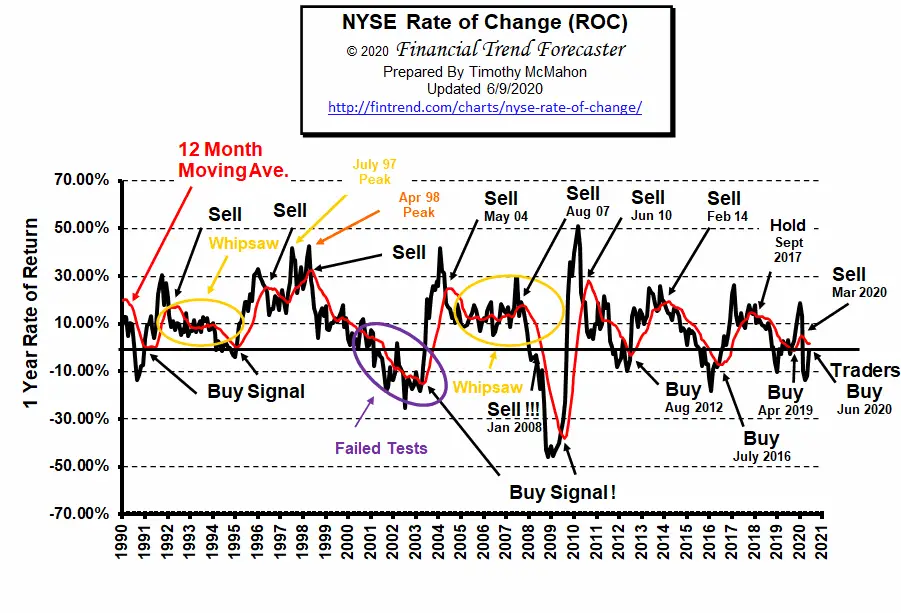
Hold Signal
NYSE levels are almost back to year-ago levels generating a “Traders Buy” signal and a Conservative Investors Hold Signal.
See the NYSE ROC for more info.
NASDAQ Rate of Change (ROC)©
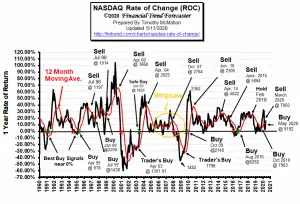
Buy Signal!
Unlike the NYSE the NASDAQ ROC did not fall below zero and has rebounded quicker. Last month the NASDAQ ROC crossed sharply back above its moving average reinstating the buy signal. This month it has tacked on another 8% gain resulting in an almost 28%annual gain.
See NASDAQ ROC for more.
Regional Inflation Information
The U.S. Bureau of Labor Statistics also produces regional data. So if you are interested in more localized inflation information you can find it here.
| AL | AK | AR | AZ | CA | CT | CO | DC | DE | FL | GA | GU | HI | IA |
| ID | IL | IN | KS | KY | LA | MA | MD | ME | MI | MN | MO | MS | MT |
| NC | ND | NE | NH | NJ | NM | NV | NY | OH | OK | OR | PA | PR | RI |
| SC | SC | SD | TX | UT | VA | VI | VT | WI | WA | WI | WV |
You Might Also Like:
From InflationData.com
- Why Inflation Affects Various Individuals Differently
- April Inflation Near Zero
- What Causes Inflation? Rising Prices Explained
- The 2008 Financial Crisis
- What are Central Banks?
- Inflation Expectations and the Massive Fed Stimulus
- What is the Federal Funds Rate?
- Will the $2 Trillion Covid-19 Stimulus Cause Inflation?
- Does the FED Control Mortgage Rates?
Read more on UnemploymentData.com.
- Tips for Starting a Business While Unemployed
- Unemployment Rate Falls Contrary to Economist’s Projections
- Unemployment Rate by State April 2020
- Why Woodworking and Manual Trades Are Still in Demand in 2020
- Coronavirus Shutdown Causes 20 Million Job Losses
From Financial Trend Forecaster
- Oil Goes from Zero to $35 in a Month, But is it Enough?
- Top 5 Reasons Why 5G Will Change the Finance Industry
- How Can Oil Be Worth Less than Nothing?
- Saudi Arabia’s Oil Price War Is Backfiring
- Electricity Rates by State
From Elliott Wave University
- Emerging Markets and Epidemics
- Deflationary Psychology Versus the Fed: Here’s the Likely Winner
- Crude Oil’s 2020 Crash: See What Helped (Some) Traders Pivot Just in Time
- Stocks: Is the Worst Over or is there Worse Yet to Come?
- Junk Bonds: 2 “Golden” Junctures
From OptioMoney.com
- Learning to Trade from Video Tutorials
- How Saxo Bank Democratizes Trading and Investment
- Five Business Tips to Help Your Company Thrive
- Have Minimal Car Insurance? What to Do in Case of an Accident
- How to Choose a Residential Roofing Contractor
From Your Family Finances
- Budget-Friendly House Flipping
- Beware Of Foreign Exchange Fluctuations When Buying A U.S. Home
- Cut Household Expenses for Your Big Family Move
- Which is Better: New Construction or a Pre-Owned Home?
- Navigating Estate Planning and Probate Law

Leave a Reply