
 Inflation is loosely described as a general economic state of rising prices. In February 2020, the US inflation rate dipped from a high of 2.5% in January, to 2.3%. Assuming the standard of steadily increasing prices, driven largely by food, fuel, and living expenses, one can expect the inflation rate to tick higher.
Forecasts for April 2020 are at 1.7%. Given that the major drivers of inflation are excess demand (demand-pull inflation), or cost-push inflation, current conditions based on Coronavirus quarantines have created a murky demand climate.
Oil Prices and Inflationary Expectations
All major US indices, including the Dow Jones Index, have plunged precipitously. Stock portfolios on the Dow Jones have lost upwards of 30% of their value, if not more as the global slide into financial oblivion continues unabated. Nothing was spared on the Dow, as a veritable tidal wave of bad data sank the Dow from almost 30,000 to under 20,000 within weeks. The unprecedented collapse mirrored the worst of what markets have endured including 1929, 1987, and 2008. As global economic activity grinds to a halt due to the coronavirus pandemic wreaking havoc on enterprises across-the-board, while an oil price war combined with sinking oil demand has driven oil prices to multi-decade lows.
On April 1, 2020, the price of WTI (West Texas Intermediate) crude oil plunged below the critical $20 support level, while Brent crude oil was hovering around the $25 per barrel level. Crude oil is widely regarded as one of the primary drivers of global economic activity, and as a barometer of such activity. Now that demand has cratered, oil prices have likewise dropped.
It is important to bear in mind that if oil prices are decreasing, and global demand is decreasing, the same is true of demand for most products and services. Although energy and oil specifically are major components of Inflation, oil is not the only component of inflation but a falling oil price will tend to drag the inflation rate down.
Quantitative Easing (QE) and the US Economy
Quantitative easing is the process by which the Federal Reserve Bank injects a massive stimulus into the economy, in an effort to drive up the velocity flow of money, thereby increasing spending and demand. The theory behind this monetary policy mechanism is that excess money flow makes it cheaper to access capital for financing purposes. Interest rates are inversely related to the money supply. When the money supply is high, interest rates are low, and vice versa. Now, the Federal Reserve Bank has instituted sweeping policy changes such as slashing the interest rate to ZERO and buying up $700 billion worth of Treasuries and mortgage-backed securities. It does this by buying up financial securities from big banks and corporations. By buying those assets from banks this is supposed to increase the money supply available to banks. The rationale behind this is: if commercial banks have more funds available, they will be more likely to lend to consumers and corporations. This credit-driven expansion at near-zero interest rates is seen as a stimulus measure that increases the total amount of currency in the economy.
But the effect of cutting interest rates to near-zero levels means that the Fed has no wiggle room to implement traditional monetary policy mechanisms any further. As a result, it has to adopt unconventional practices to stimulate economic activity. Including quantitative easing or negative interest rates. As an extreme measure, the Federal Reserve Bank has it within its purview to deliver money directly to consumers a.k.a. “helicopter money” which is exactly what the current “CARES ACT” is. The Fed is scrambling to make the US economy more liquid and it is doing it by sending each person a check and increasing unemployment benefits by $600 a week.
The extra $600 a week, however, might have the unintended consequences of incentivizing staying unemployed for many people on the lower levels of the pay scale. For instance, if you previously earned the average wage in the hospitality industry of $410.65 and you collect $250 in State Unemployment and an additional $600 from the Federal Government you would actually be making more than twice as much being unemployed as you made while working. So it would be logical to stay unemployed as long as they could. The same logic would apply to retail workers who earn an average of $626.03 a week so if their state unemployment check was $400 combined with an extra $600 Federal check they would be getting $1000 being unemployed. Even Transportation and Warehousing workers who average $964.22 a week might get $600 in unemployment and another $600 from the Federal Government so it still pays for them to remain unemployed as long as possible.
Can Access to Cheap Money Help the US Economy?
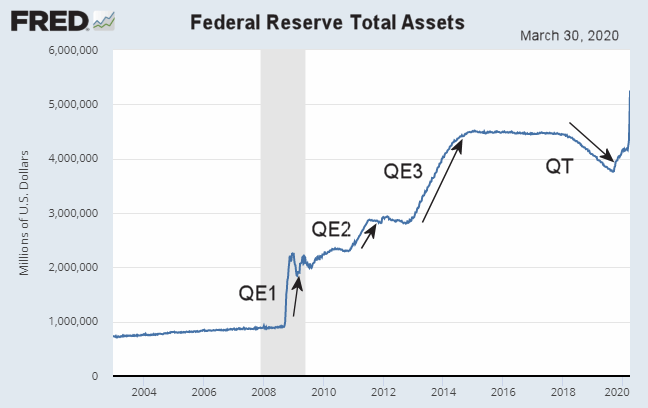
The expectation is that ready access to funds will significantly boost aggregate demand, thereby driving up economic activity. Increasing aggregate demand invariably raises inflation expectations over time. This is precisely what happened after the Financial Crisis of 2008 when the Federal Reserve Bank aggressively rolled out a massive Quantitative Easing program to reignite the US economy after one of the worst meltdowns in the history of the country. But as you can see in the chart below the FED has recently increased assets very similarly to QE1 in an effort to head off a recession before it even starts.
The actions of the Fed can have an impact on inflation. For the most part, inflation was stable and consistent through 2019. With consumer prices hovering around 2% in January 2019, allowing the Fed to hold off on interest-rate hikes. From January 2019 through January 2020, the interest rate rose steadily, before contracting in February 2020. The Fed has consistently targeted an inflation rate of 2%, and deemed that essential to healthy economic growth.
Unfortunately, the global pandemic has upended any notion of economic stability, causing massive and unprecedented disruption to the everyday functioning of businesses and entire industries. A severe economic crisis is now on our doorstep, and the Fed’s actions are an attempt to stave off an unprecedented economic recession. Fortunately, deflation fears appear to be at bay, given that demand and supply declines are simultaneously taking root. This is significantly different from the Great Depression in the 1920s and 1930s, or the economic collapse of 2008, but we’re only in the infancy stages of this crisis.
Read More:

Leave a Reply