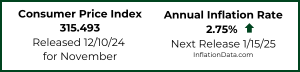
The U.S. Bureau of Labor Statistics (BLS) released its April Inflation report on May 12th, 2020, for the 12 months through the end of April 2020.
Annual Inflation Down Sharply… Again!
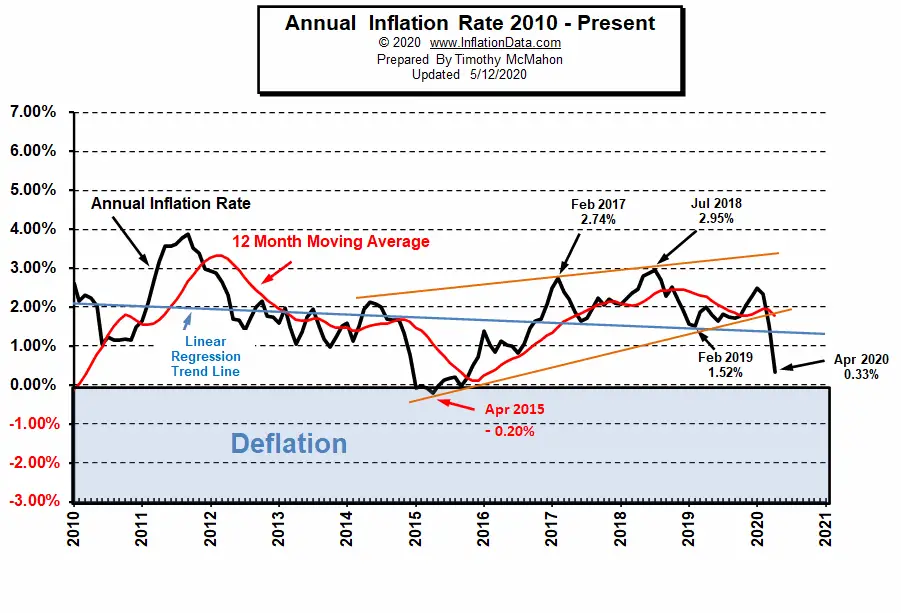
- Inflation fell sharply to 0.33% in April from 1.54% in March, 2.33% in February and 2.49% in January.
- CPI Index in 258.115 in March fell to 256.389 in April.
- Monthly Inflation for April was -0.67%, March was -0.22%, February was 0.27% typically January through May are highly inflationary so this is VERY unusual.
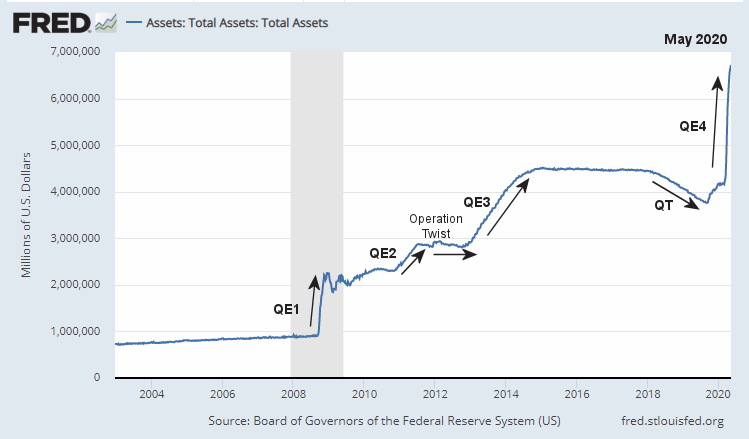
- The FED has massively cranked up the “printing presses” using “Quantitative Easing” in an effort to stimulate the economy in the wake of COVID-19.
- FED Funds Rate down to near Zero.
- Next release June 10th
Annual inflation for the 12 months ending in April was 0.33% a full 2% below February’s 2.33%.
March was 1.54%, and January was 2.49%.
The CPI index itself fell to 256.389 down from 258.115 in March from 258.678 in February creating MONTHLY deflation although there was still slight ANNUAL inflation.
Prices falling on a monthly basis but rising on an annual basis is called disinflation.
Currently, the inflation rate is well below the FED’s target 2% rate and very near zero.
Monthly Inflation:
According to the BLS commissioner’s report, “The Consumer Price Index for All Urban Consumers (CPI-U) declined 0.8 percent in April on a seasonally adjusted basis, the largest monthly decline since December 2008, the U.S. Bureau of Labor Statistics reported today. Over the last 12 months, the all items index increased 0.3 percent before seasonal adjustment. A 20.6-percent decline in the gasoline index was the largest contributor to the monthly decrease in the seasonally adjusted all items index, but the indexes for apparel, motor vehicle insurance, airline fares, and lodging away from home all fell sharply as well. In contrast, food indexes rose in April, with the index for food at home posting its largest monthly increase since February 1974. The energy index declined mostly due to the decrease in the gasoline index, though some energy component indexes rose.”
Seasonally Adjusted Inflation Table
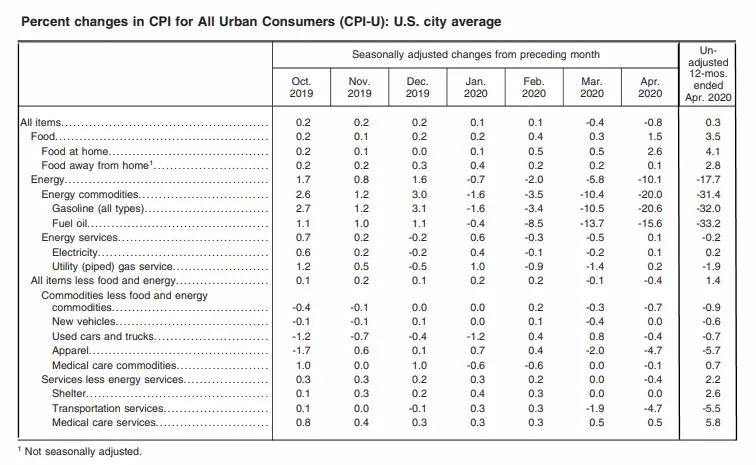
The key words from the Commissioner’s report are “Seasonally Adjusted” and “Monthly” we can see the -0.8% that he’s talking about at the top of the April column.
Also from the April 2020 column in the table above we can see that on a MONTHLY seasonally adjusted basis, Energy was down -10.1%. On a Non-adjusted annual basis, however, energy was down -17.7%, over the entire year. In April alone, Gasoline was down -20.6% and fuel oil was down -15.6%. On a monthly basis, Food was up 1.5%, shelter was unchanged, Apparel was down -4.7% and Medical care services were up 0.5%.
Current Inflation Situation
Annual inflation for the 12 months ending in April was an astonishingly low 0.33% down sharply primarily due to lower oil prices and the Coronavirus shutdown. That puts the inflation rate well below the FED’s target 2% rate, the FED is also currently concerned with a market meltdown due to falling Oil prices and the Coronavirus. Thus it has been pumping up the money supply via a massive Quantitative Easing program i.e. QE4.
For more information See Annual Inflation.
 Federal Reserve Actions
In response to the recent Coronavirus stock market crash, the FED has implemented QE4 equal in speed to QE1 and greater in magnitude than QE1 and QE3 combined. Many believe that this will create massive inflation in the days to come. See Inflation Expectations and the Massive Fed Stimulus and Will the $2 Trillion Covid-19 Stimulus Cause Inflation? for more information.
FED Funds Rate
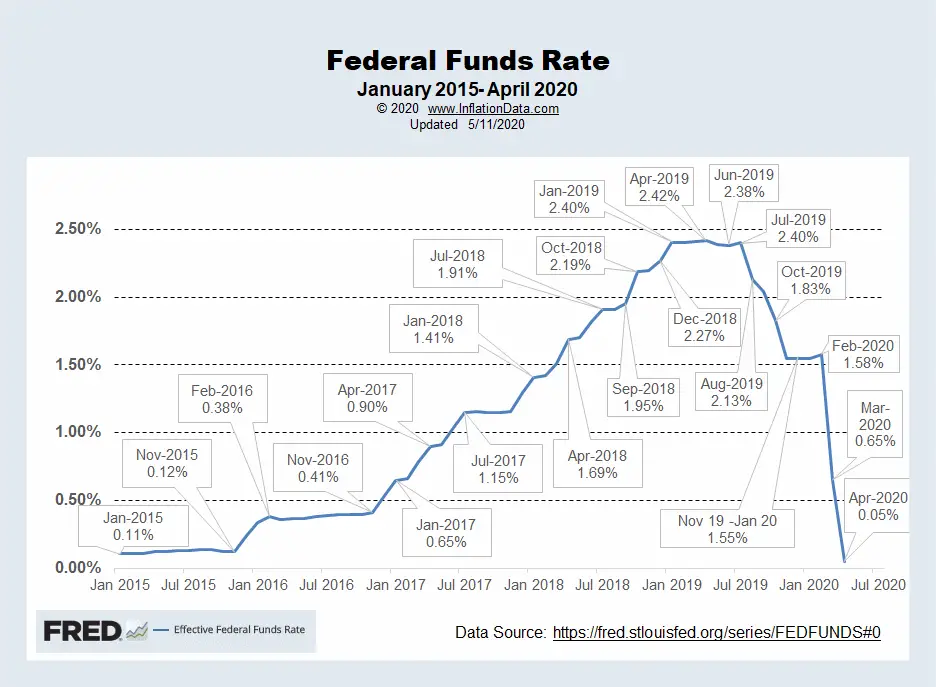
In early 2019, with inflation falling to around 1.5%, the FED stopped raising FED Funds rate at around 2.4%. By July, inflation was back up to 1.81% (i.e. still below the 2% target) so the FED lowered the FED Funds rate significantly falling from 2.40% in July to 1.55% in November (at that point inflation was back up to 2.05%). The FED halted the easing by holding the FED Funds rate steady at 1.55% from November through January 2020 by which time inflation had climbed to 2.49%. So the FED raised interest rates slightly in February to 1.58% and inflation fell to 2.33%.
And then the Oil Price War between Russia and Saudi Arabia began, combined with the Coronavirus shutdown and inflation rates tumbled, so effective March 3rd the FED set its FED’s Funds target range at 1%- 1.25% but actually lowered it even further to 0.65% by the end of March. Big Banks were speculating that the FED would end up lowering rates to zero by year-end. But it came much sooner than that, as rates were at virtually zero (0.05%) by the end of April.
 For more info See NYSE ROC and MIP.
Inflation Forecast
The monthly inflation rate for February was a typical 0.27% but lower energy prices drove March’s monthly inflation rate down to -0.22%. and April’s monthly inflation down to -0.67%. Typically January through May are the most inflationary months of the year, so replacing two of those months with negative numbers eliminates most of the inflation for the year, making this very rare. The last time we had negative monthly inflation in a March month was in 1982 and 1986. Prior to that, we have to go all the way back to 1948 to find one. April had negative monthly inflation in 2013, 2003, 1986, 1954, and 1939.
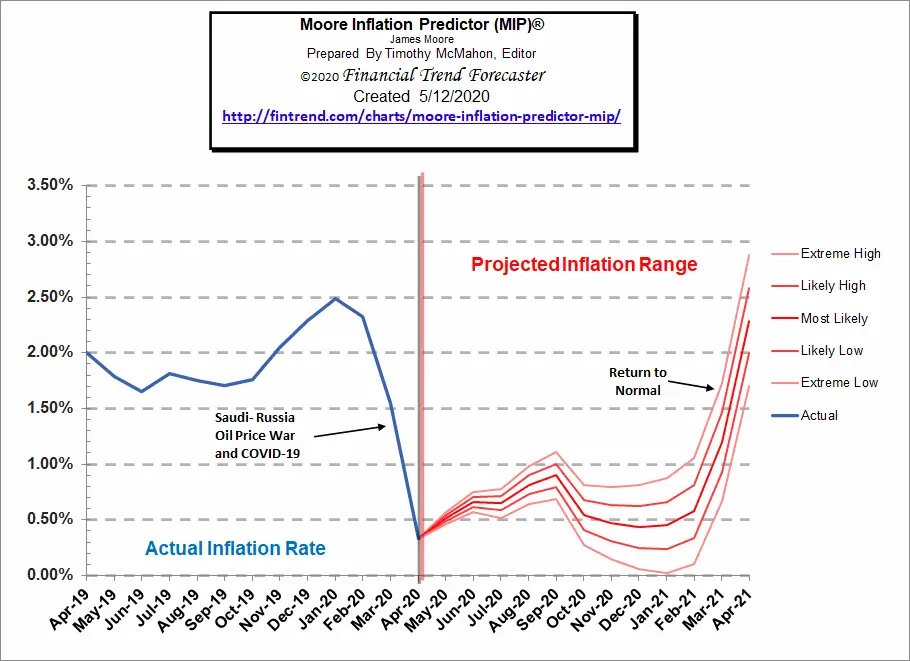
See our Moore Inflation Predictor to see our current projections.
Not Seasonally Adjusted Monthly Inflation Rates
| Jan | Feb | Mar | Apr | May | Jun | Jul | Aug | Sep | Oct | Nov | Dec | |
| 2016 | 0.17% | 0.08% | 0.43% | 0.47% | 0.41% | 0.33% | (0.16%) | 0.09% | 0.24% | 0.12% | (0.16%) | 0.03% |
| 2017 | 0.58% | 0.31% | 0.08% | 0.30% | 0.09% | 0.09% | (0.07%) | 0.30% | 0.53% | (0.06%) | 0.00% | (0.06%) |
| 2018 | 0.54% | 0.45% | 0.23% | 0.40% | 0.42% | 0.16% | 0.01% | 0.06% | 0.12% | 0.18% | (0.33%) | (0.32%) |
| 2019 | 0.19% | 0.42% | 0.56% | 0.53% | 0.21% | 0.02% | 0.17% | (0.01%) | 0.08% | 0.23% | (0.05%) | (0.09%) |
| 2020 | 0.39% | 0.27% | (0.22%) | (0.67%) |
See: Monthly Inflation Rate for more information and a complete table of Unadjusted Monthly Rates.
Misery Index
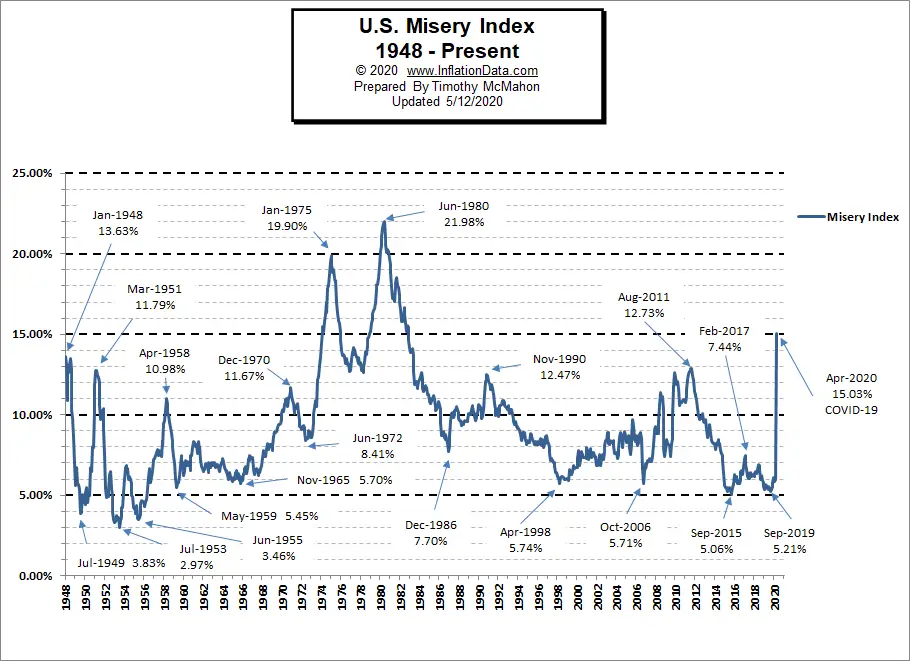
In March, the Misery Index was at 5.94% based on 4.4% unemployment and 1.54% inflation. But due to the COVID related jump in Unemployment, the Misery Index for April shot up to 15.03% based on 14.7% unemployment and 0.33% inflation. The highest peak for 2019 was at 5.79% in December and the Low was in September at 5.21%. Previous peaks were 6.87% in July 2018 and 7.44% in February 2017.
[Read More…]
NYSE Rate of Change (ROC)©
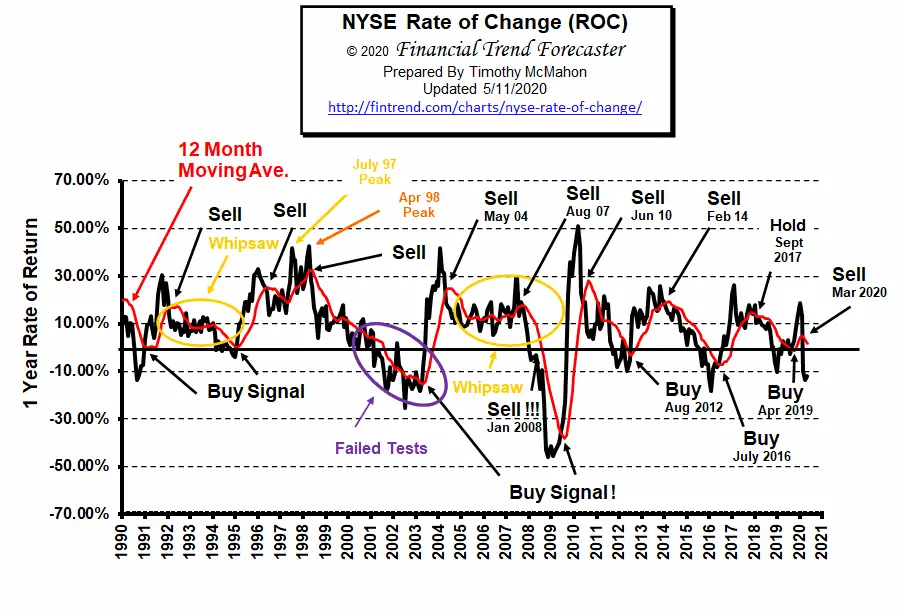
Sell Signal
After passing a milestone of doubling since the September 2011 low (up 108.8%) the market was panicked into a massive “correction” by a combination of the CoronaVirus (COVID-19) and falling oil prices. Back on April 10th the NYSE rebounded to 11,136.61 so it was “only” down 13.59% from year-ago levels. This month it has gained another 1.3% bringing the annual rate of return to -11.78%.
See the NYSE ROC for more info.
NASDAQ Rate of Change (ROC)©
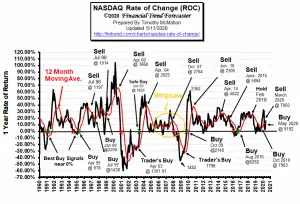
Buy Signal!
Unlike the NYSE the NASDAQ ROC did not fall as low and has rebounded quicker. It did not cross below the zero-line. Last month we said, “However, in the last week, it has rebounded from an open on Monday of 7,660 to 8,153 as of the close on Thursday.” This month the NASDAQ ROC has crossed sharply back above its moving average reinstating the buy signal.
See NASDAQ ROC for more.
Regional Inflation Information
The U.S. Bureau of Labor Statistics also produces regional data. So if you are interested in more localized inflation information you can find it here.
| AL | AK | AR | AZ | CA | CT | CO | DC | DE | FL | GA | GU | HI | IA |
| ID | IL | IN | KS | KY | LA | MA | MD | ME | MI | MN | MO | MS | MT |
| NC | ND | NE | NH | NJ | NM | NV | NY | OH | OK | OR | PA | PR | RI |
| SC | SC | SD | TX | UT | VA | VI | VT | WI | WA | WI | WV |
You Might Also Like:
From InflationData.com
- What Causes Inflation? Rising Prices Explained
- The 2008 Financial Crisis
- What are Central Banks?
- March Inflation Crashes
- Inflation Expectations and the Massive Fed Stimulus
- What is the Federal Funds Rate?
- Will the $2 Trillion Covid-19 Stimulus Cause Inflation?
- Does the FED Control Mortgage Rates?
Read more on UnemploymentData.com.
- 4 Industries That Are Urgently Hiring Essential Workers
- 7 Reasons to Consider a Career in Data Analytics
- How to Be a High Productivity Individual at Work
- Essential Jobs That Are in High Demand During Emergencies
- Dealing With Temporary Disability After a Workplace Injury
- 8 Reasons Why You Should Pursue Higher Education (Now!)
- 5 Jobs Every Company Needs and How You Can Get One
From Financial Trend Forecaster
- Top 5 Reasons Why 5G Will Change the Finance Industry
- How Can Oil Be Worth Less than Nothing?
- Saudi Arabia’s Oil Price War Is Backfiring
- Electricity Rates by State
- Oil Is Now More Volatile Than Bitcoin
From Elliott Wave University
- Deflationary Psychology Versus the Fed: Here’s the Likely Winner
- Crude Oil’s 2020 Crash: See What Helped (Some) Traders Pivot Just in Time
- Stocks: Is the Worst Over or is there Worse Yet to Come?
- Junk Bonds: 2 “Golden” Junctures
- Is the Buying Opportunity Here Yet?
- Did the Oil Crash Wreck the Stock Market?
From OptioMoney.com
- Learning to Trade from Video Tutorials
- How Saxo Bank Democratizes Trading and Investment
- Five Business Tips to Help Your Company Thrive
- Have Minimal Car Insurance? What to Do in Case of an Accident
- How to Choose a Residential Roofing Contractor
From Your Family Finances
- Are We Switching From a Sellers to a Buyers Real Estate Market?
- Essential Investment Considerations for Seniors
- What to Do If Your House is Sagging?
- 4 Signs You’re Financially Ready to Buy a Home
- Things You Should Know When Investing During Your Retirement Years


Leave a Reply