Inflation Summary: Annual Inflation up sharply from 2.62% in March to 4.16% in April. CPI Index rose massively from 264.877 in March to 267.054 in April. Monthly Inflation for March was 0.71% and for April was 0.82%. We have to go back to the Oil Peak of 2008 to see higher inflation. Next release June 10th Annual inflation for the 12 months ending in April was 4.16% We have been predicting Annual Inflation would shoot up in March and April due to negative numbers falling out of the annual calculation. Since the BLS rounds their numbers to 1 decimal place they reported March as 2.6% and April as 4.2% taking inflation well above the FED's 2% target rate. Due to … [Read more...]
Managing Business During Periods of Inflation
When a currency's purchasing power declines, the average cost of goods and services rise, and the economy in question enters a period of inflation. This affects not only individual consumers and families but businesses as well. COVID-19 has rocked the global economy like nothing we've seen or experienced for a century. And the government's response has been to create massive quantities of liquidity. This means that a period of inflation could very well be on the horizon. If a business is to effectively circumvent this difficult economic period, it should be preparing for the challenges that lay ahead. Here are four things a business can do to prepare for the next inflationary … [Read more...]
March Inflation Skyrockets
Inflation Summary: Annual Inflation up from 1.68% in February to 2.62% in March. CPI Index rose slightly from 263.014 in February to 264.877 in March. Monthly Inflation for February was 0.55% and March was 0.71%. Next release May 12th Annual inflation for the 12 months ending in March was 2.62% We have been predicting Annual Inflation would shoot up in March due to higher gas prices and negative numbers falling out of the annual calculation. Further increases to come in April and May. Since the BLS rounds their numbers to 1 decimal place they reported February as 1.7% and March as 2.6% for a monthly increase of 9/10ths of 1% taking inflation well above the FED's 2% … [Read more...]
How Inflation Can Effect Rising Prices
In the field of economics, many experts agree that the long-term effects of inflation are dependent on the money supply in a country. Alternatively, the price levels are directly proportional to the money supply in the long run. Therefore, the money supply or the currency in circulation can directly affect the prices of goods and services. The confusion arises because both monetary inflation (an increase in the money supply) and price inflation (an increase in consumer prices) are both commonly referred to as "inflation". Even though many people consider money printing to be the cause of more money in circulation, physical paper in circulation is actually only a small percentage of the … [Read more...]
February Inflation Increases 20% over January
Inflation Summary: Annual Inflation up from 1.40% in January to 1.68% in February. CPI Index rose from 261.582 in January to 263.014 in February. Monthly Inflation for January was 0.43% and February was 0.55%. Next release April 13th Annual inflation for the 12 months ending in February was 1.68%, a 20% increase over January's 1.40% The CPI index itself was up from 261.582 in January to 263.014 in February. Resulting in a monthly inflation rate of 0.55% which replaced February 2020's 0.27%. Annual inflation for the 12 months ending in February was 1.68%, since the BLS rounds their numbers they report it as 1.7%. Setting the Stage for Inflation Due to the Corona … [Read more...]
January Inflation Setting Stage for Big Run Up
Inflation Summary: Annual Inflation up from 1.36% in December to 1.40% in January. CPI Index rose slightly from 260.474 in December to 261.582 in January. Monthly Inflation for December was 0.09%, January was 0.43%. Next release March 10th Annual inflation for the 12 months ending in January was 1.40% The CPI index itself was up from 260.474 in December to 261.582 in January. Resulting in a monthly inflation rate of 0.43%. Annual inflation for the 12 months ending in December was 1.36%, the 12 months ending in January was 1.40%. Since the BLS rounds their numbers they report both as 1.4%. Setting the Stage for Inflation Due to the Corona Virus, March and April … [Read more...]
Using Risk to Combat Inflation
Inflation is a fact of life that everyone must deal with. Even when inflation is "low", it gradually takes its toll on your assets. The result of low inflation is that your purchasing power gradually erodes even though you might have the same amount of money. In order to combat this, you have to earn more or increase the rate of return on your investments. Often a simple savings account won't even pay enough interest to cover the losses due to creeping inflation. In that case, the only way to beat inflation is to take on additional risk to increase your rate of return. Taking on additional risk, however, means that you could suffer other types of losses. So, in order to properly manage … [Read more...]
December Inflation Up Slightly
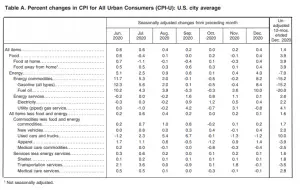
Inflation Summary: Annual Inflation up from 1.17% in November to 1.36% in December. CPI Index rose slightly from 260.229 in November to 260.474 in December. Monthly Inflation for December was 0.09%, November was -0.06%. Next release February 10th BLS Commissioner's Inflation Report: According to the BLS commissioner's report, "The Consumer Price Index for All Urban Consumers (CPI-U) increased 0.4 percent in December on a seasonally adjusted basis after rising 0.2 percent in November, the U.S. Bureau of Labor Statistics reported today. Over the last 12 months, the all items index increased 1.4 percent before seasonal adjustment. The seasonally adjusted increase in the all … [Read more...]
November Inflation Virtually Flat
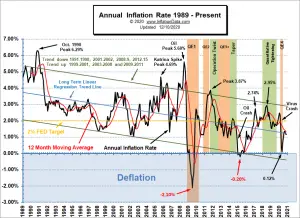
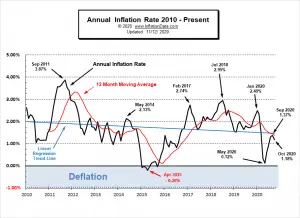
Inflation Summary: Annual Inflation was virtually unchanged from 1.18% in October to 1.17% in November. CPI Index fell slightly from 260.388 in October to 260.229 in November. Monthly Inflation for November was -0.06%, October was 0.04%, September was 0.14%, August was 0.32%, July was 0.51%, June was 0.55%, May was 0.002%, April was -0.67%, March was -0.22%, February was 0.27%. Next release January 13th Annual Inflation Chart: Looking at the Annual Inflation Chart since 1989 we can see a marked downward trend. Current Inflation Situation Looking at just the most recent 10 years the trend is … [Read more...]
Annual Inflation in October is 1.18%
Inflation Summary: Annual Inflation fell from 1.37% in September to 1.18% in October. CPI Index rose slightly from 260.280 in September to 260.388 in October. Monthly Inflation for September was 0.14% and only 0.04% in October. FED Funds Rates decrease slightly while FED Assets inch up. Next release December 10th Annual Inflation Chart: Looking at the Annual Inflation Chart since 1989 we can see a marked downward trend. Current Inflation Situation Looking at just the most recent 10 years the trend is … [Read more...]

